Microsoft Clarity + Claude: Turning Session Recordings and Heatmaps Into a Funnel Fix List
Clarity shows where visitors struggle, not which ad sold. How to get Clarity data into Claude, rank fixes by drop-off and friction, and review them.
 Ray GillespieCo-Founder & COO
Published 9 min read
On this page
Key takeaways
- Clarity is a diagnostic, not attribution. It shows where visitors struggle, not which ad made the sale.
- The official Clarity MCP server lets Claude query aggregate metrics, not watch recordings, and it allows 10 requests a day per project covering at most 3 days.[1]
- Pull the data daily and store it. The Export API only reaches the last 1 to 3 days.[2]
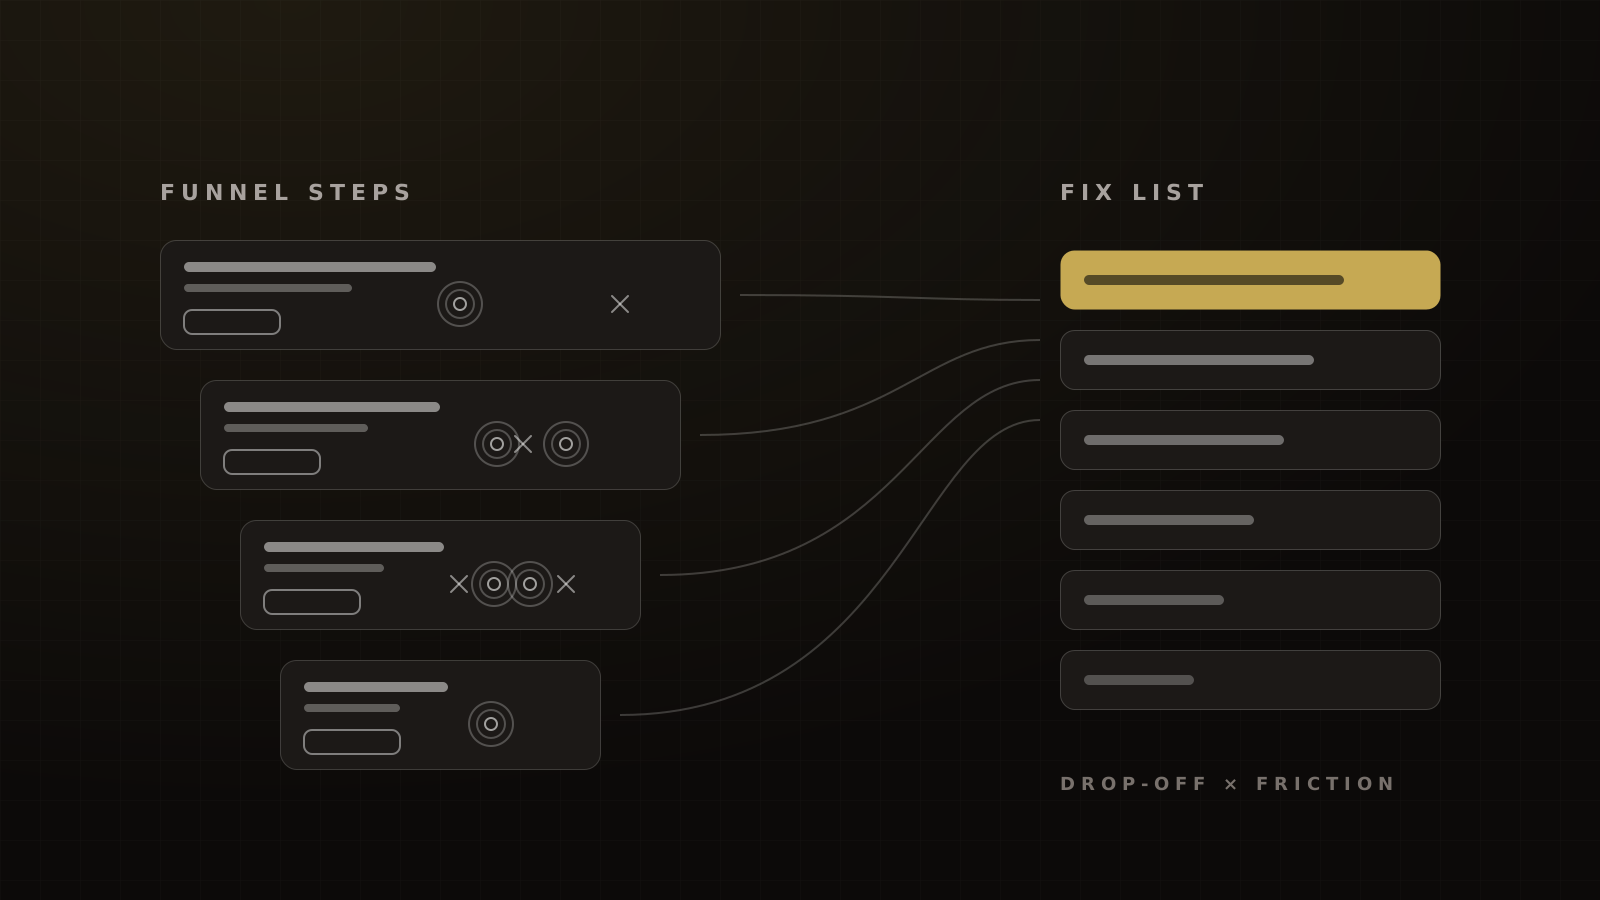
- Rank fixes by stage drop-off × the share of sessions showing friction, and give every item its supporting recordings.
- A person watches the recordings behind the top three items, and every fix ships as a test.
Most funnel owners install Microsoft Clarity, look at a heatmap once, and never open it again. The recordings pile up. Nobody has three hours to watch them.
The fix isn't watching more. It's asking a better question of the data you already have. Give Claude Clarity's friction signals for each funnel step, the funnel's goal, a page map and your stage conversion rates, and it can return a ranked fix list with the evidence behind each item. A person then checks the top of the list against the actual recordings, and the fixes ship as tests.
This is the AI-assisted layer. For the manual method, reading heatmaps and recordings by hand, see session recordings and heatmaps. For where this sits in our wider stack, see AI marketing operations.
Clarity is a diagnostic, not attribution
Start with what each tool is for. Clarity is free with no traffic limits.[3] It records sessions and builds heatmaps. It doesn't tell you which ad, audience or email produced a buyer.
One naming note. Searches for "Microsoft Clarity AI" also return Clarity's Copilot and its Citations feature, which reports how a site shows up in AI-generated answers and went generally available on 2026-05-13.[4] An unrelated ESG data company is also called Clarity AI. This article is about Clarity's behaviour data and Claude.
| Question | Tool | What it can't do |
|---|---|---|
| Where did visitors struggle on this page? | Microsoft Clarity | Tell you revenue or attribution; recordings kept 30 days[3] |
| Where did traffic come from and what converted? | GA4 | Show behaviour on the page; event data kept 2 or 14 months for explorations[5] |
| Which ad produced the buyer? | Your attribution tool (we use Hyros) | Explain why a page underperforms |
Retention figures are for standard settings. GA4 retention applies to explorations and funnel reports, not standard aggregated reports.
The tools don't merge cleanly, either. Clarity can't use GA4 segments, and Clarity's playback URLs aren't sent to GA4.[6] Keep the questions separate and the answers stay honest.
The four signals worth ranking
Clarity defines four friction signals that matter most on a funnel page:[7]
- Rage click: several clicks in a tight area in quick succession. On a registration page, it usually means something looks clickable and isn't, or a button is slow to respond.
- Dead click: a click with no visible response and no navigation. Often an image, a price or a date someone expected to expand.
- Quick back: the visitor leaves to another page and comes back faster than that page's normal dwell time. On a sales page, they went looking for something you didn't show, such as the price, the date or proof.
- Excessive scrolling: more scrolling than the page's average. The visitor is hunting for something.
Always state the denominator
Friction benchmarks look comparable and aren't. Three vendors, three denominators:
- Per session: rage clicks appeared in 5.3% of retail sessions in 2025, per Contentsquare.[8]
- Per page: Contentsquare's per-page rage-click rate runs from 2.4% in travel to 0.8% in software.[9]
- Per 1,000 sessions: Fullstory reported 122 rage clicks and 438 dead clicks per 1,000 sessions in April 2024.[10]
The direction is worsening in some sectors. Fullstory's 2024 data, across 9.5 billion web sessions, showed rage clicks up 56% in retail and 85% in financial services year over year.[11] That's relative change, not a rate.
Clarity also publishes its own benchmarks across 14 categories, updated daily.[12] Compare your page to those, against the same metric Clarity reports, before you compare it to anyone else's.
Getting the data to Claude
There are three routes. Most teams need two of them.
Option A: the Clarity MCP server in Claude Desktop
Microsoft launched a free Clarity MCP server on 2025-06-04, built to answer analytics questions in plain language from AI clients including Claude Desktop.[13] It returns aggregate metrics such as scroll depth, engagement time and traffic, filtered by browser, OS, country or device. Each project allows up to 10 requests a day, covering at most 3 days of data, with up to 3 dimensions per request.[1]
It doesn't return recordings or heatmap images. Higher limits, multi-project support and predictive heatmaps are listed as planned, not shipped.[1] Use it for quick questions, not as your archive.
Option B: a daily Export API pull
The Data Export API returns the friction counts directly: dead clicks, rage clicks, quick backs, excessive scroll, script errors and error clicks, plus scroll depth, engagement time and traffic. You can break them down by source, medium, campaign, channel and URL. It allows 10 requests per project per day, covers only the previous 1 to 3 days, takes up to 3 dimensions and returns up to 1,000 rows with no pagination. Only project admins can manage the tokens.[2]
That shape has one consequence: pull daily and store it. If you only pull on Fridays, you only ever see Wednesday to Friday. A daily pull to a sheet or CSV, one row per URL per day, gives Claude weeks of history instead of 72 hours.
Option C: Copilot session summaries as recording notes
Neither route above sees inside a recording. Clarity's Copilot does: it offers chat, session insights, grouped session insights, heatmap insights and ad campaign insights inside Clarity.[14] Paste its grouped session summaries into the same thread as your own notes on five to ten recordings. That's the qualitative layer Claude can't get from the numbers.
The prompt: goal, page map, data, ranking rule
Claude needs four things Clarity doesn't have: the funnel's goal, the page map, your stage conversion rates and a rule for ranking.
Stage rates need a reference point, split by traffic source. These are the bars we hold, next to the nearest public figures.
| Stage | Our target | Industry figure |
|---|---|---|
| Cold Meta traffic to a generic opt-in page | 15% to 22% | Facebook-referred visitors: 13%[15] |
| Warm email or SMS list to a registration page | 25% to 35% | Email-referred visitors: 19.3% average[15] |
| Cold traffic to a $7 to $47 sales page | 3% to 6% | Digital products under $50: 3% to 5%, estimated[16] |
Our figures are operator targets from the funnels we run, not a dataset. Unbounce figures are 2024 data from Unbounce-hosted pages. The ClickFunnels figure is an estimate.
Split by device, too. Contentsquare's 2026 benchmark found conversion at 3.4% on desktop and 2% on mobile.[17] A friction problem that only exists on phones gets lost in a blended number.
Then the prompt:
Goal: visitors register for the webinar on [date]. Registration is step 2 of 4.
Page map: 1 ad landing page, 2 registration form, 3 confirmation page, 4 VIP upsell.
Data: the attached daily Clarity exports for the last 21 days (one row per URL
per day, split by device and source), plus my notes on 8 recordings and
Copilot's grouped session insights.
Stage conversion: [step-by-step rates, by device and traffic source].

1. For each step, compare conversion with the target for its traffic source.
2. For each step, give the share of sessions with rage clicks, dead clicks,
   quick backs or excessive scrolling.
3. Rank fixes by (gap to target) x (share of sessions showing friction).
4. For each fix: the evidence, the likely cause, the change, and the 5 recordings
   I should watch to confirm it.
5. Flag anything that could be consent, tracking or iframe gaps rather than
   real drop-off.
Step five matters more than it looks. Some apparent drop-off is the measurement, not the visitor. More on that below.
The review step a human must own
Claude ranks hypotheses. A person decides which ones become tests.
Microsoft says the same about its own AI. Clarity's FAQ tells users to double-check Copilot's output, says its takeaways shouldn't be treated as expert recommendations, and notes that heatmap insights don't do mathematical computations.[3]
The research is consistent. Baymard's purpose-built UX-Ray 2.0 tool matched its human auditors more than 95% of the time across 346 heuristics on 79 sites.[18] That's a specialised, mostly non-generative pipeline, not an estimate for a general-purpose model. An academic comparison of multimodal language models against usability experts found their findings complementary to the experts', not equivalent.[19]
Vendor cases show the upside. Optimum reported a 7.8% lift in shopper-to-order conversion after fixes found with Contentsquare's AI analyst, with analysis time cut from two to three hours to minutes.[20] Harrods reported checkout-form rage clicks down 50% and cart abandonment down 8% after form and payment fixes.[21] Neither case discloses a control group.
So our review rule is short:
- Watch the recordings behind the top three items. If you can't see the problem, it isn't confirmed.
- Ship each confirmed fix as a test, one change at a time. Claude Hopkins made the case a century ago: key every test and judge it by cost per customer, not by opinion.
- Re-measure on the same denominator you started with.
Contentsquare's 2026 benchmark found 35.2% of sessions affected by at least one frustration signal.[22] After a fix pass, our target is to bring the share of sessions showing any friction signal on the fixed step down to 25% to 30%. Detection rules differ between vendors, so read that as a direction, not a like-for-like comparison.
What Clarity can't tell you
- Attribution and revenue. Use the CRM and your attribution tool.
- Third-party iframes. Clarity can't render third-party iframes,[3] so an embedded calendar or checkout can look like a dead end when it isn't.
- Anything older than 30 days. Recordings are kept for 30 days, with favourites and a random sample kept up to nine months.[3]
- Visitors who didn't consent. From 2025-10-31, Clarity enforces a consent signal for visitors in the EEA, UK and Switzerland.[23] Missing journeys from those regions may be consent, not abandonment.
Privacy settings before you connect anything
- Consent. Clarity needs explicit consent in the EEA, UK and Switzerland before its cookies run. Microsoft describes Clarity as GDPR-compliant "as a data controller", and says it shouldn't be used on sites aimed at under-18s.[3]
- Masking. Balanced mode, the default, masks numbers and email addresses. Input boxes and drop-downs are masked in every mode, and masked content is never uploaded. CSS isn't masked, and changes aren't retroactive.[24] Set masking before launch, not after.
- Tokens. Only project admins manage Export API tokens.[2] Keep them in the agency's account.
US session-replay litigation risk is covered in session recordings and heatmaps. Our rules for what goes into an AI tool are in the AI data-safety checklist.
For the Claude setup this runs on, see Claude for marketing operations. For where Clarity sits next to the other tools, see our AI lane map, and for the full CRO method, funnel conversion rate optimization.
Want a second pair of eyes on your funnel's numbers? Get a funnel audit.
Frequently asked questions
Sources
- 1.Microsoft Clarity MCP server. Microsoft Learn, 2026-06-24.
- 2.Clarity Data Export API. Microsoft Learn, 2024-11-26 (updated 2025-12-05).
- 3.Clarity FAQ. Microsoft Learn, viewed 2026-10-04.
- 4.Citations now generally available. Microsoft Clarity blog, 2026-05-13.
- 5.Data retention. Google Analytics Help, viewed 2026-10-04.
- 6.Clarity and Google Analytics 4 integration. Microsoft Learn, 2025-01-13.
- 7.Semantic metrics. Microsoft Learn, 2025-12-01.
- 8.Retail digital experience benchmark: frustration. Contentsquare, 2026-02-12 (updated).
- 9.Travel and hospitality digital experience benchmark: frustration. Contentsquare, 2026-02-20 (updated).
- 10.The top 5 behavioral metrics data-driven leaders should prioritize. Fullstory, 2024-04-09.
- 11.Consumer mobile frustration is rising, and it's costing brands. Fullstory, 2025-07-15.
- 12.Clarity website benchmarks. Microsoft Clarity, viewed 2026-10-04.
- 13.Introducing the Microsoft Clarity MCP Server. Microsoft Clarity blog, 2025-06-04.
- 14.Copilot in Clarity overview. Microsoft Learn, 2025-05-12 (updated 2025-12-05).
- 15.Conversion Benchmark Report. Unbounce, 2024-08-29.
- 16.Traffic but no sales. ClickFunnels, 2026-09-17.
- 17.2026 Digital Experience Benchmark: engagement. Contentsquare, 2026-03-09.
- 18.AI heuristic evaluations: UX-Ray 2.0 accuracy. Baymard Institute, 2026-05 (updated).
- 19.Multimodal LLMs vs usability experts in heuristic evaluation (arXiv 2508.16165). Lubos et al., arXiv, 2025-08.
- 20.Optimum customer story. Contentsquare, undated, viewed 2026-10-04.
- 21.Harrods customer story. Contentsquare, undated, viewed 2026-10-04.
- 22.2026 Digital Experience Benchmark: frustration. Contentsquare, 2026-04-01.
- 23.Clarity Consent API v2. Microsoft Learn, viewed 2026-10-04.
- 24.Masking content in Clarity. Microsoft Learn, 2024-11-01 (updated 2025-12-05).
Written by
Ray GillespieCo-Founder & COO
Ray runs day-to-day operations across every Victory engagement, building the systems, automations and AI-powered workflows that hold the machine together. He has overseen operations behind more than $120M in revenue.
Part of the guide: AI Marketing Operations: How a Modern Agency Runs Funnels with Claude, Agents and Automation