Funnel CRO: Benchmarks, Diagnostics and Tests for Coaching, Course and Event Funnels
Fix the stage that leaks most before you add ad spend. Stage benchmarks for coaching, course and event funnels, a tracking gate, and a test order.
 Ray GillespieCo-Founder & COO
Published 19 min read
On this page
- Why "what's a good conversion rate?" is the wrong first question
- Step zero: prove your tracking before you test anything
- Stage benchmarks for coaching, course and event funnels
- The diagnostic: four symptoms, four leaks
- Why a higher opt-in rate can make you less money
- Page-level fixes that move the number
- Testing when you don't have Amazon's traffic
- Choosing the right funnel shape
- Common mistakes
Key takeaways
- Funnel CRO means finding the one stage where the most money leaks (opt-in, show, book or close) and fixing it before you add ad spend.
- The most quoted benchmark, Unbounce's 6.6%, is a median of landing pages, not an average, and it leaves out pages that never converted.[1][2]
- Traffic source moves the number more than industry does. Education pages convert 5.1% from paid social and 14.1% from email.[3]
- Prove your tracking before you test anything. Duplicate events, lost cross-domain sessions and missing consent data all look like conversion problems.
- A higher opt-in rate can make you less money. Judge the funnel on buyers and revenue per 1,000 visitors, not on opt-ins.
Funnel conversion rate optimization, for a coaching, course or event business, is not a page redesign. It's a search for the one stage where the most money leaks, followed by a fix for that stage alone. Then you look again.
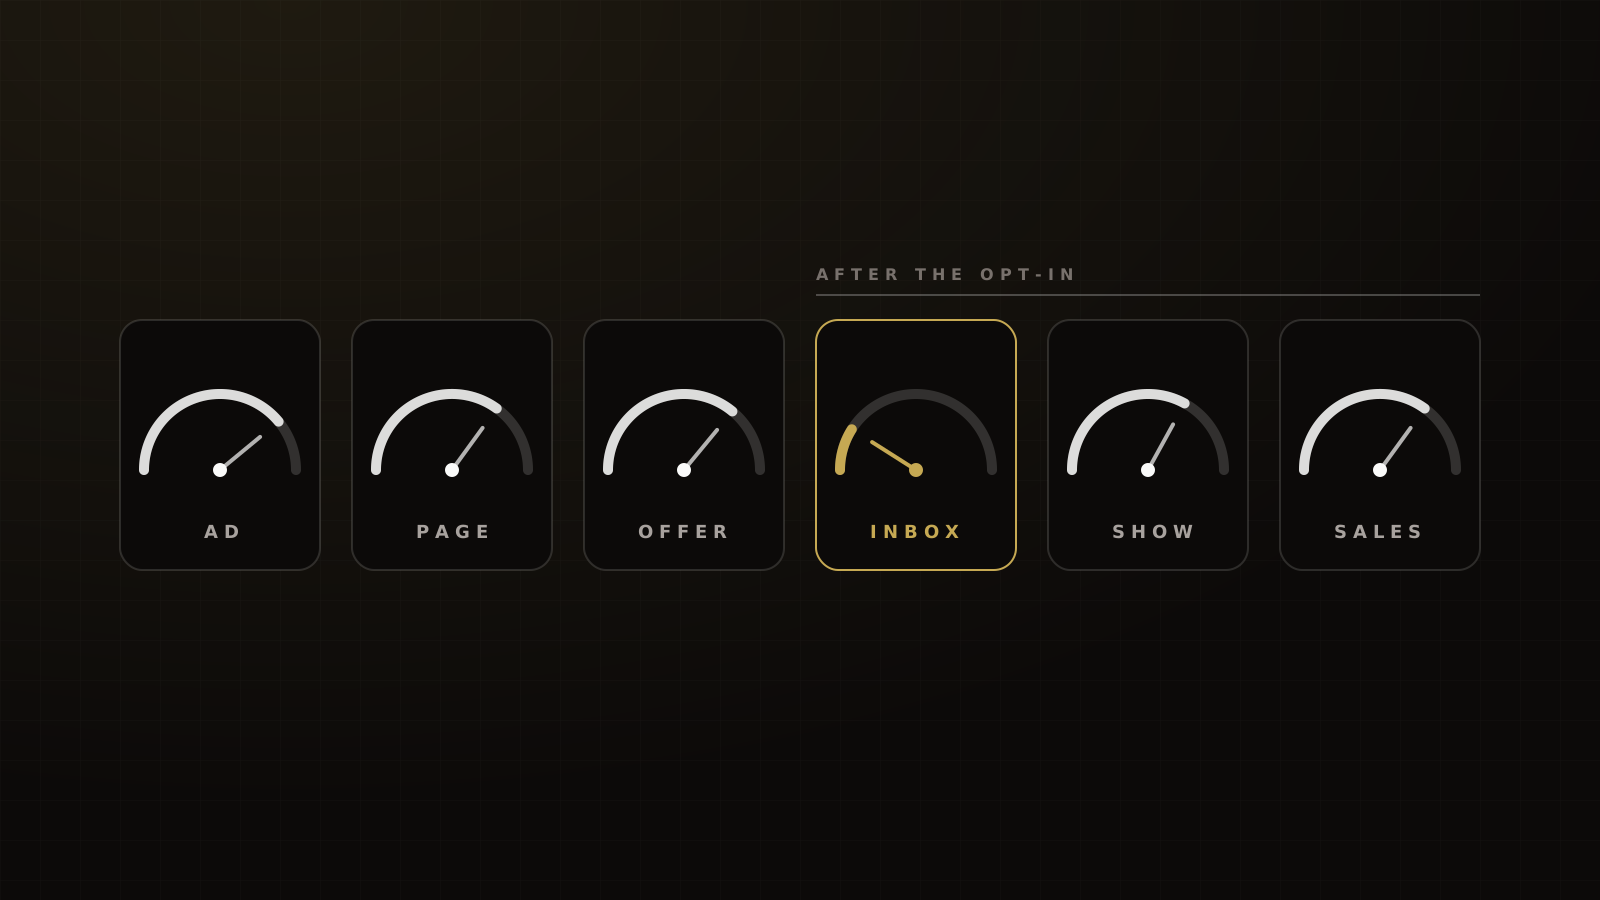
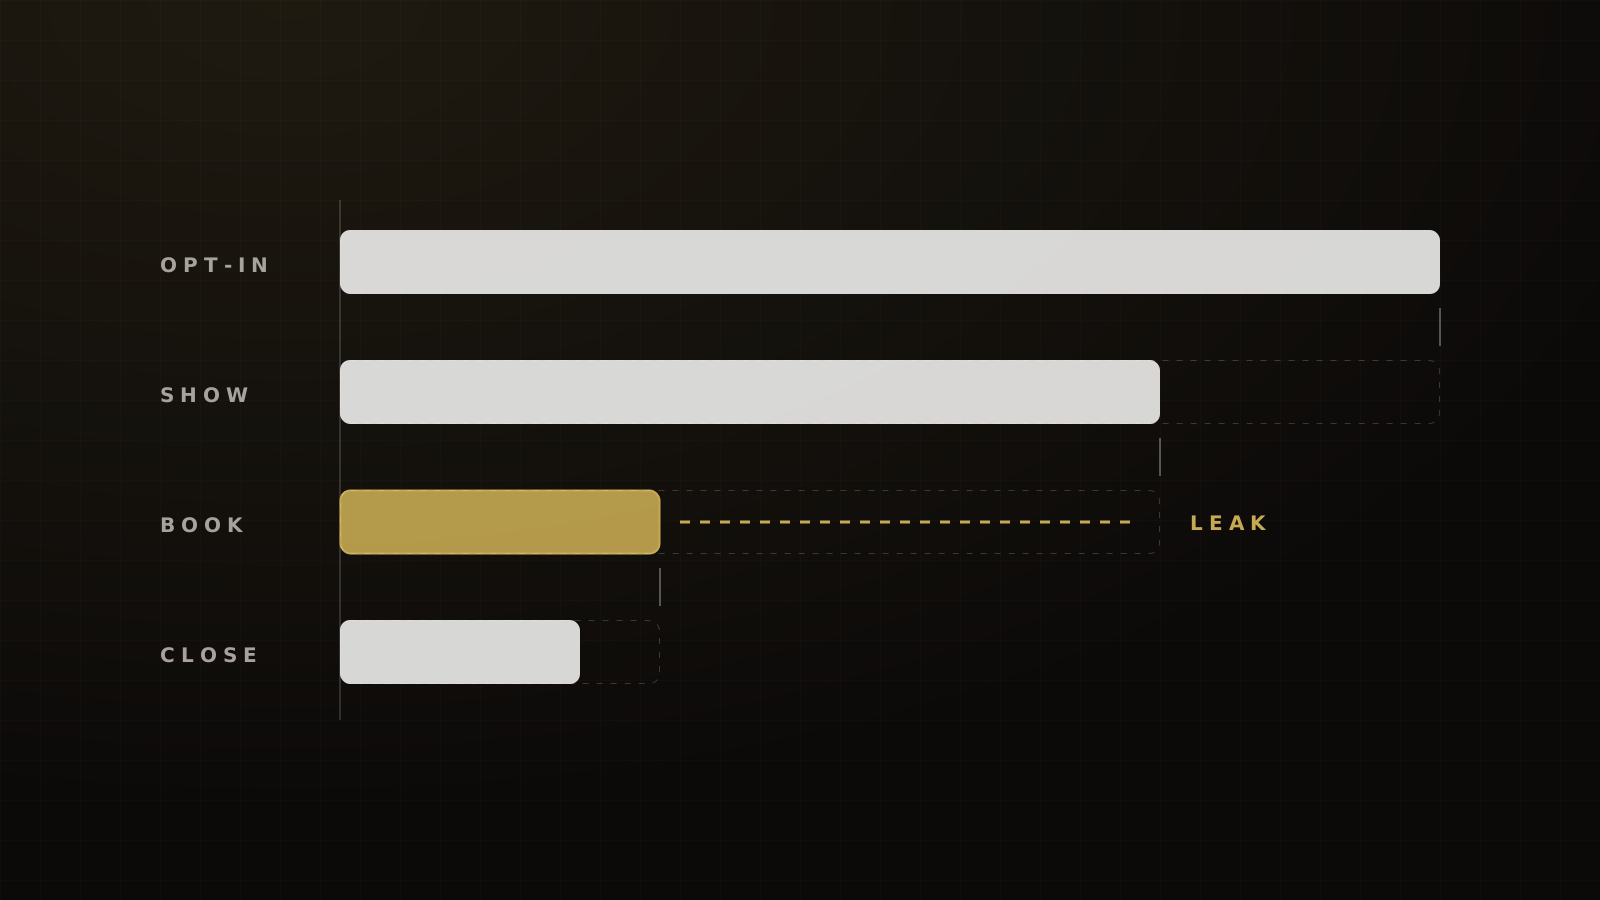
The stages are simple: ad click to opt-in, opt-in to show, show to booked call or purchase, booked call to held call, held call to close. One of them is almost always far below where it should be. That's the one to fix first, and the one to fix before you add a dollar of spend.
Ray has a line for it on client calls: sharpen the axe before you chop down the tree. More traffic into a leaking funnel buys you a bigger leak.
This guide covers how to read the published benchmarks without fooling yourself, the tracking gate we run before any test, stage benchmarks for coaching, course and event funnels with our own numbers next to the industry's, a four-symptom diagnostic, and a testing order for funnels that don't have Amazon's traffic.
Why "what's a good conversion rate?" is the wrong first question
"What's a good conversion rate?" is usually the first thing a founder asks us. It's the wrong first question, for two reasons. The famous benchmarks don't measure what people think they measure. And a funnel has at least four different conversion rates, each with its own denominator.
A median, not an average: what Unbounce's 6.6% measures
Unbounce's 2024 Conversion Benchmark Report is the most cited source on landing pages. It studied more than 41,000 pages and 464 million visitors between July 2023 and July 2024. Its headline: the median conversion rate across all industries is 6.6%.[1]
Median landing page conversion rate across all industries, 41,000+ pages, July 2023 to July 2024
Three things about that number matter.
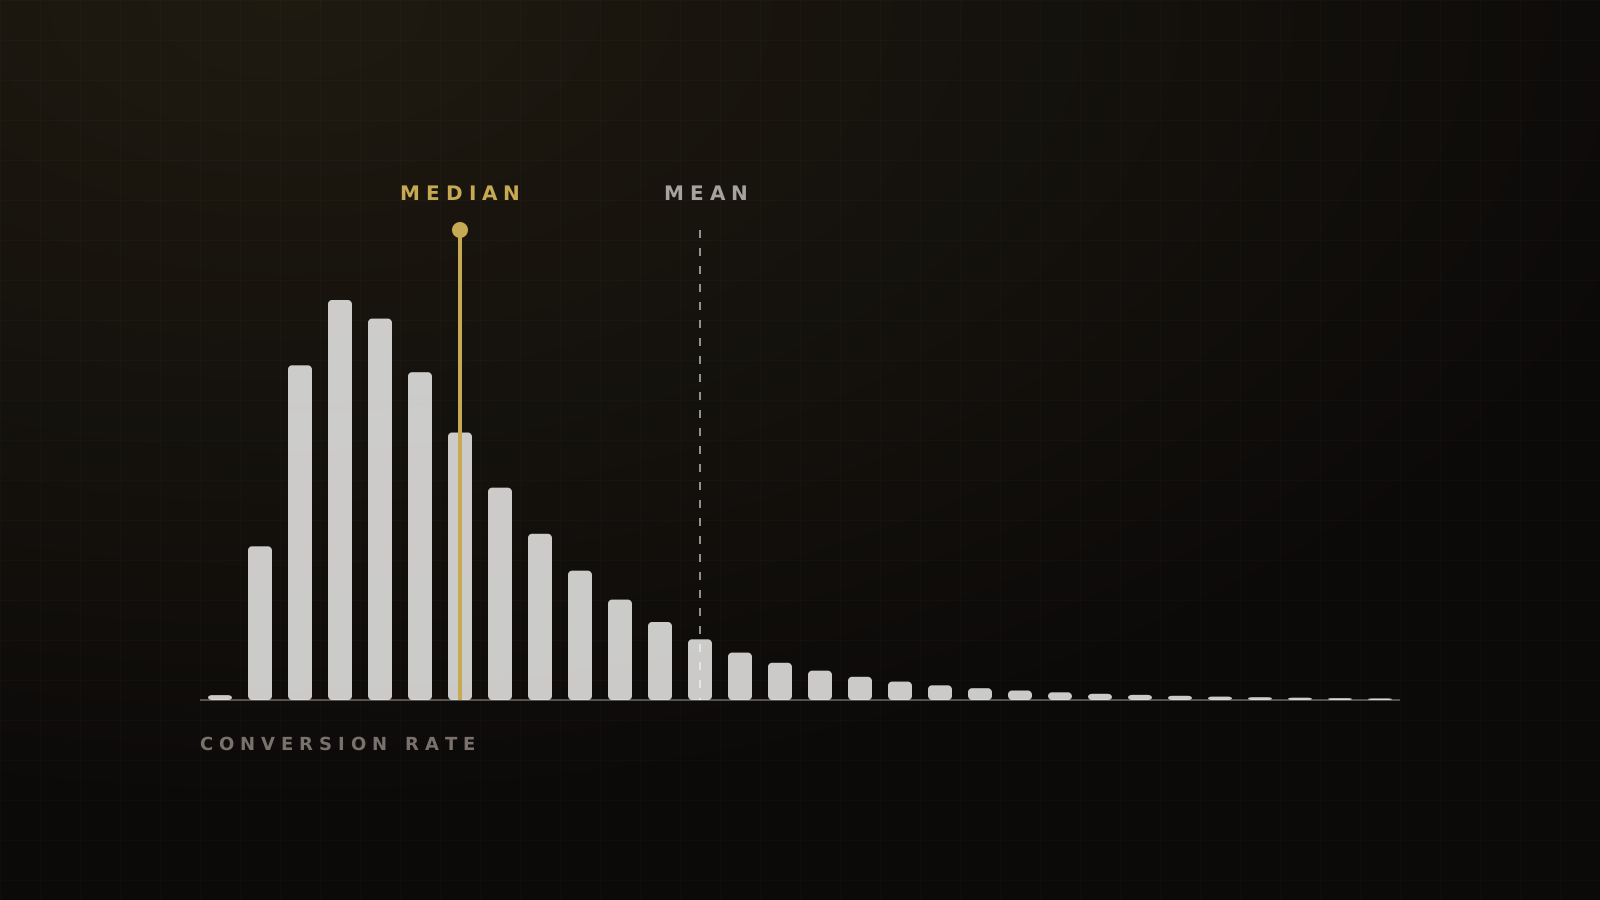
First, it's a median. Half the pages sit above it and half below. It's not an average, though most blogs call it one.
Second, the sample is filtered. Unbounce drops pages with fewer than 50 visitors and pages with zero conversions, and it drops industries with fewer than 400 pages.[2] Removing every page that never converted pushes the median up.
Third, means and medians can sit far apart in this kind of data. In Unbounce's 2020 report, the same dataset produced a 3.2% median and a 9.7% mean.[4] That 9.7% is where the widely repeated "average landing page converts at 9.7%" comes from. A few very high-converting pages drag the mean up.
The education numbers are closer to our readers. Education pages have an 8.4% median. Online course pages sit at 18.3%, which Unbounce puts down to how many of them offer something free or cheap.[3] The top quarter of education pages convert at 20% or more.[5]
Four denominators people confuse
A conversion rate is a fraction. Most bad benchmarking comes from comparing fractions with different bottoms.
| Rate | Denominator | Example figure |
|---|---|---|
| Landing page conversion | Unique visitors to one page | Education pages, 8.4% median[3] |
| Ad-platform conversion | Clicks reported in the ad account | Meta lead campaigns, Education, 15.87% leads per click[6] |
| Webinar attendance | Registrants (live, or live plus on-demand) | 47.7% live in 2025;[7] 60% including on-demand[8] |
| Close rate | Held sales calls, or buyers over leads | No reliable public figure for coaching calls |
Each figure is real and correctly sourced. They just measure different things, so they can't be compared with each other.
The Meta figure is the one that trips people up most. LocaliQ's 2026 benchmarks put Education and Instruction lead campaigns at 15.87% conversion and $26.31 per lead.[6] That's leads divided by clicks, as Meta reports them, and it can include instant forms. It is not a landing page rate. A 15% page conversion from cold Meta traffic is very good. A 15% "conversion rate" in Ads Manager may just be average.
Webinar attendance has the same problem. Livestorm measured a 47.7% live show-up rate across 7 million registrations in 2025.[7] ON24 reports 60%, but its figure includes people who watched on demand.[8] Goldcast's B2B report put attendance at 33% for 2024 webinars.[9] Before you compare your show rate with anyone's, find out what they counted.
Step zero: prove your tracking before you test anything
Many of the "conversion problems" we audit turn out to be measurement problems. A funnel that double-counts purchases looks like it's working. A funnel that loses the visitor's source at the checkout looks like the ads don't work. Before you change a headline, prove the numbers are real.
Duplicate Pixel and Conversions API events
Most funnels now send events twice: once from the browser Pixel and once from the server through the Conversions API. That's fine, as long as Meta can tell they're the same event.
Meta deduplicates a Pixel event and a server event only when both carry the same event ID and the same event name, and the second arrives within 48 hours of the first.[10] If those keys don't match, Meta counts both. Your cost per lead halves on paper, and the algorithm optimizes toward a number that isn't real.
The check: in Events Manager, look at whether your lead and purchase events show as deduplicated. Then compare a day's leads in Meta with a day's new contacts in your CRM. They should be close.
Cross-domain checkout, calendars and iframes
Coaching and event funnels rarely live on one domain. The page is on one, the calendar on another, the checkout on a third.
In GA4, a visitor who crosses root domains without cross-domain measurement counts as two users and two sessions. The linker passes a _gl parameter in the URL to stitch them together.[11] Without it, every booking and purchase looks like it came from a referral, and your paid traffic looks like it never converts.
Embedded calendars and order forms add another blind spot. Microsoft Clarity can't render third-party iframes, and it only captures clicks inside first-party ones.[12] If your booking widget is a third-party iframe, your session recordings will show people staring at a blank box.
Consent mode and missing data
Consent rules change what you can measure. Google's Consent Mode v2 uses four parameters (ad storage, analytics storage, ad user data and ad personalization), and the defaults have to be set before any measurement call fires.[13] Set them late and you lose data. Set them wrong and you collect data you shouldn't.
Clarity has enforced consent signals for visitors from the EEA, the UK and Switzerland since 31 October 2025.[14] If you run traffic there, expect gaps in recordings until consent is wired up properly.
A $0 test of the whole chain
The fastest audit is to become a lead yourself. Click your own ad from a phone. Opt in with a fresh email address. Book the call. Buy the offer with a $0 or 100%-off coupon.
Then check every system. Did the Pixel and the server event both fire, and deduplicate? Did GA4 keep the source through the checkout? Did the CRM tag the contact correctly, start the right workflow and send the confirmation email to the inbox, not the spam folder? Did the calendar booking land in the closer's calendar?
It's a short exercise, and it catches more than a week of dashboards.
Stage benchmarks for coaching, course and event funnels
Here's the table we wish existed when we started. The public column is the best published figure we could verify, with its denominator. The middle column is what good looks like on the funnels we run. These are operator ranges from our experience, not a dataset.
| Stage | Public benchmark | What good looks like for us | First fix if you're below |
|---|---|---|---|
| Cold Meta click → generic opt-in | Facebook-referred visitors 13%, all industries;[1] education paid social 5.1%[3] | 15–22% | Match the page headline to the ad's promise |
| Cold Meta click → webinar or event registration | Education paid social 5.1%[3] | 22–30% | Lead with the outcome, cut the form to essentials |
| Warm email/SMS click → registration | Email-referred 19.3% average;[1] education email 14.1%[3] | 25–35% | Check the email actually reached the inbox |
| Registration → live webinar show, cold paid traffic | 47.7% live, all registrants, 2025[7] | 25–35% | Confirmation page, reminders, a short ad window |
| Registration → live webinar show, warm list | 47.7% live, 2025[7] | 40–50% | Reminder cadence and send timing |
| Registration → free one-day in-person event | No comparable public figure in this dataset | 35–45% | Confirmation page with every detail, short promotion window |
| Live attendee → buyer, $1K–$10K offer | No reliable public benchmark | 6–10% (1–3% is failing) | The offer and the pitch, not the page |
| Booked call → held call | B2B demos: 13.5% median no-show[15] | 82–88% held, booked no more than ~3 days out | Shorten the booking window |
| Cold click → low-ticket ($7–$47) purchase | Vendor estimate 3–5%, not measured[16] | 3–6% | Checkout friction and the order form |
Public figures come from mixed industries and platforms, so treat them as context. Victory ranges are our operating experience on coaching, course and event funnels, not a published study. Where no public benchmark exists, we say so.
Ad click → opt-in or registration: cold Meta vs email
Cold and warm traffic are different populations, so they need different targets.
Unbounce's education data shows the gap clearly: 14.1% from email, 7.3% from paid search and 5.1% from paid social.[3] Cold social traffic converts at about a third of the email rate.
On the funnels we run, cold Meta traffic to a generic opt-in or lead-magnet page typically converts 15% to 22%. A free webinar or event registration page on the same traffic converts 22% to 30%. Warm email and SMS traffic to a registration page converts 25% to 35%.
Those are well above Unbounce's all-industry medians, and that's the point. A free, specific, dated invitation to a single audience should beat a mixed-industry median. If your cold registration page sits at 5%, it's at the education paid-social median, which is a long way from good.
When we see a client say "the ads aren't working", the opt-in rate is usually the first thing we look at. More often than not, the ads are delivering clicks and the page is losing them.
Registration → show
Show rate is where coaching and event funnels quietly lose the most money. Everyone you paid to register who doesn't show is a cost with no chance of a return.
For webinars, the honest split is cold vs warm. Livestorm's 47.7% live show-up rate for 2025 is a cross-platform figure, mostly from organizations promoting to their own audiences.[7] On cold paid traffic to a single-date evening webinar, we typically see 25% to 35% live. Promoting to a warm house list (email, SMS, community), we see 40% to 50%.
For a free one-day in-person event, we see 35% to 45% of registrants show up when it's run well: a short promotion window, a steady reminder cadence and a confirmation page with every detail.
Timing matters more than most people expect. On our best webinar program, ads run only in the 2 days before the event. Running them 2 weeks out raises cost per lead and lowers show rate. That program has brought our webinar CPL down to $4 to $5, the lowest we've seen, with week-over-week ROAS of 4x to 7x. Those are our results on one program, under those conditions, not a promise for every offer.
For the full playbook on getting people to show, see our guide to the thank-you page as a show-rate tool.
Show → booked call or purchase
Here's the uncomfortable truth: no reliable public benchmark exists for the share of webinar or event attendees who book a call or buy a $1K to $10K coaching offer. The figures that circulate are self-reported or unsourced.
So here's ours, as a target. On a $1K to $10K webinar offer, 6% to 10% of live attendees buying is what good looks like for us. At 1% to 3%, we treat the webinar as failing and look at the offer and the pitch before anything else.
A useful proxy from the course side: Kajabi found that only 4.0% of 36.2 million customer relationships that started with something free ever bought anything.[17] That's lead to any purchase, not attendee to buyer, but it shows how much of a free list never converts without a deliberate sales step.
Booked → held → closed
The booked-call show rate is the most fixable number in a high-ticket funnel, and the one founders watch least.
The closest public data is B2B. RevenueHero's high-volume customers see a median no-show of 13.5% and an average of 15.9% on booked sales meetings.[15] On the phone calls we run, 82% to 88% of booked calls are held when the call is booked no more than about 3 days out. Longer booking windows leak.
Close rate on held calls is the last stage, and the least published. We haven't found a method-disclosed public close rate for cold-traffic, high-ticket coaching calls. Anyone quoting a single figure is guessing or selling.
Checkout
For low-ticket offers, the checkout is the close. On cold traffic to a $7 to $47 sales page, we typically see 3% to 6% of visitors buy. The nearest public figure is a ClickFunnels estimate of 3% to 5% for digital products under $50, which the company itself doesn't present as a measured benchmark.[16]
The best checkout research is from ecommerce, so label it that way. Baymard's average of 50 studies puts cart abandonment at 70.22%.[18] The top reasons US shoppers give are extra costs (40%), being forced to create an account (18%) and a long or complicated checkout (17%).[18] The average checkout shows 23.48 form elements, where 12 to 14 is achievable.[18]
None of that is a course checkout benchmark. All of it applies to your order form: show the full price, skip the account creation, cut the fields.
The diagnostic: four symptoms, four leaks
Most funnels show one of four symptoms. Each points to a different leak and a different first check. Our full funnel diagnostic walks through each one with thresholds. Here's the short version.
Framework
Four symptoms, four leaks
- Clicks but no opt-ins. The leak is the ad-to-page handoff. Run Brunson's three questions: did the hook stop the right person, did the story on the page build enough value, and was the offer worth the ask? If link CTR is healthy and the page converts well below your traffic source's benchmark, the page or the offer is the problem.
- Opt-ins but no shows. The leak is after the form. Check inbox placement, the confirmation page and the reminder sequence before you touch the ad.
- Shows but no bookings or sales. The leak is the offer or the pitch. The traffic and the page did their job. Look at what you asked for, how you asked and whether the price fits the trust you've built.
- Bookings but no sales. The leak is the sales process: booking window, show rate on calls, speed to first contact and the closer's call itself.
Victory's diagnostic order. The first symptom uses Russell Brunson's Hook, Story, Offer as a three-question test; the stage view follows his seven phases of a funnel.
A few thresholds make the first two symptoms concrete.
For the ad, link CTR on a working cold Meta webinar or event ad runs 1.8% to 2.5% in our accounts. LocaliQ's 2026 benchmark for Education and Instruction lead campaigns is 1.74%.[6] If you're inside our range and the page still doesn't convert, the ad isn't your problem.
For the page, Microsoft Clarity's rage clicks, dead clicks and quick backs show where visitors get stuck: repeated clicks in one spot, clicks that do nothing, and people who leave and come straight back.[19] Our guide to session recordings and heatmaps covers how to read them. And if you want the AI-assisted version, our AI marketing operations pillar covers how we pair Clarity with Claude.
For follow-up, inbox placement is the hidden one. Validity's 2026 benchmark put global inbox placement at 87.2% in 2025, so roughly 1 in 8 emails missed the inbox.[20] On domains we manage, our target after remediation is 90% or better on pre-send seed tests. A registration confirmation that lands in spam is a no-show you paid for.
Why a higher opt-in rate can make you less money
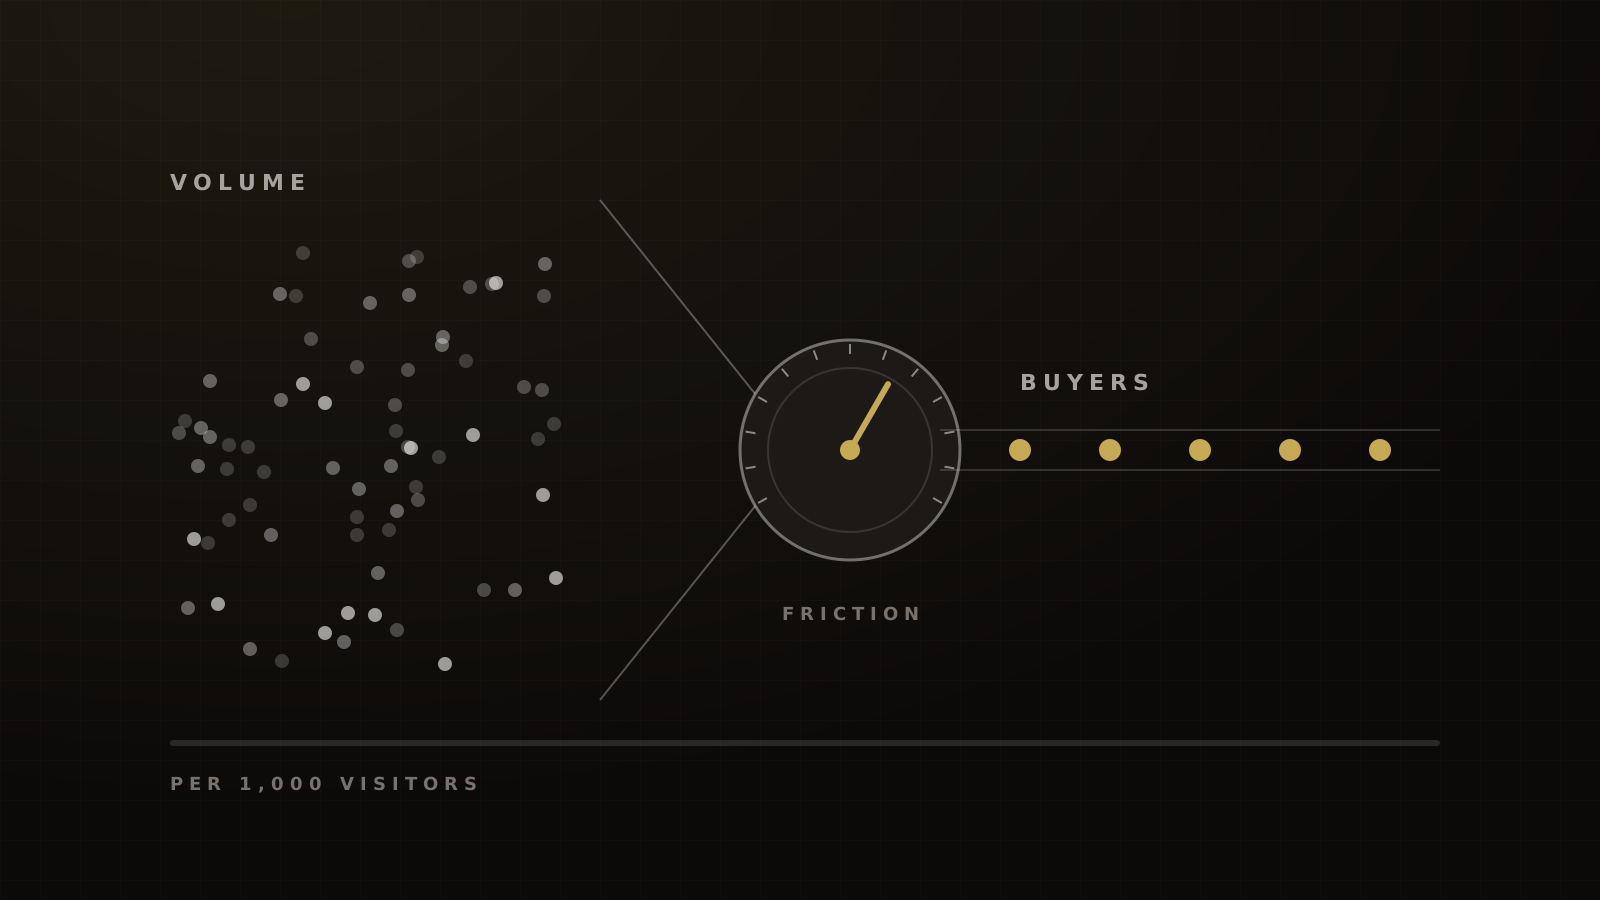
Opt-in rate is the easiest number to raise and the most dangerous one to optimize alone. Strip the form to one field, promise more, remove every qualifier, and opt-ins go up. Buyers often don't.
Alex Hormozi makes the general case: friction lowers lead volume and raises lead quality, so you tune it to the volume you need. In $100M Leads he also argues that the real output of advertising isn't leads at all: "Engaged leads are the true output of advertising."
The volume side of that trade is well documented. In one B2B form test, going from 5 fields to 9 cut conversion from 13.4% to 10% and raised cost per lead from $31.24 to $41.90.[21] GetResponse's data shows pages with 1 to 3 fields converting at similar rates, around 11% to 13%, with the drop coming at 4 or more fields.[22] Neither study tracked who went on to buy. That's the half nobody measures.
Here's the arithmetic that matters, with made-up numbers:
| Easy page | Qualifying page | |
|---|---|---|
| Opt-in rate | 30% | 18% |
| Leads | 300 | 180 |
| Lead → buyer rate | 2% | 5% |
| Buyers | 6 | 9 |
| Buyers per 1,000 visitors | 6 | 9 |
Hypothetical figures to show the math, not a client result. Swap in your own rates.
The easy page wins on every metric in the ad account and loses on the only one that pays. That's why we judge pages on buyers, booked calls and revenue per 1,000 visitors, not on opt-ins.
We might get fewer booked calls from here, but they'll be less confused when they show up.
For more on where friction belongs, see where the friction should go in a funnel.
Page-level fixes that move the number
Once you've confirmed the page is the leak, these are the fixes we reach for first, roughly in order of how often they matter.
Page fixes, in the order we check them
- Message match. The page headline repeats the ad's promise in the ad's words. A visitor should know at a glance that they're in the right place.
- Reading level. Unbounce found pages written at a 5th to 7th grade reading level converted at 11.1%, against 5.3% for professional-level copy.[1] It's a correlation, not a controlled test, and it matches everything we see.
- Mobile first. 83% of landing page visits in Unbounce's data were on mobile, while desktop converted 8% better.[1] Design and test on a phone, then check desktop.
- Speed. In a Google-commissioned Deloitte study of 37 brands, a 0.1-second mobile speed improvement was associated with 8.4% more retail conversions and 21.6% better lead-gen form progression. The data is from 2019.[23] Portent's 2022 analysis found lead-gen pages loading in 1 second converted about 3x better than pages loading in 5.[24]
- Form length. Ask only what you'll use. The cliff in GetResponse's data was at 4 or more fields.[22]
- Fewer steps. Every extra page loses people and adds a place for tracking to break.
- The confirmation page. Times, location, add-to-calendar and what to do next. It's the first page of your show-rate system, not the last page of your opt-in.
Hormozi's value equation is a useful lens for all of this. Value rises with the dream outcome and the perceived likelihood of getting it, and falls with time delay and effort. Most page fixes are effort cuts: fewer fields, faster loads, plainer words, no hunting for the button.
For a worked example of a page rewrite on cold event traffic, see our event landing page case study.
Numbers to stop repeating
A handful of conversion "facts" travel from blog to blog with the source stripped off.
- "1 second of delay costs 7% of conversions." Akamai's 2017 retail report said a 100-millisecond delay can hurt conversion rates by 7%.[25] It's retail data, and it's almost ten years old.
- "The average landing page converts at 2.35%." That's WordStream's 2014 median for Google Ads account conversion rates, not landing pages.[26]
- "The average landing page converts at 9.7%." That's the mean from Unbounce's 2020 report, from 2019 data. The median in the same data was 3.2%.[4]
Testing when you don't have Amazon's traffic
Most coaching and event funnels don't have the traffic for textbook A/B testing, and most tests don't win anyway. Across more than 127,000 experiments on Optimizely's platform, only 12% produced a statistically significant win on the primary metric.[27]
The traffic math is sobering. CXL's worked example: at a 3% baseline conversion rate, detecting a 10% relative lift needs 51,486 visitors per variation.[28] Most funnels we see never reach that on a single page.
So small funnels need a different approach. Three ideas do most of the work.
Test big things first. Jason Fladlien's optimization hierarchy, from his webinar training, puts the offer first, then the audience, then the message, and only then the page details. A new offer can double a result. A new button color can't. Fladlien also warns that once a webinar converts, changing the presentation is more likely to hurt than help, so improve the pages and emails around it instead.
Find the constraint, then change one thing. Hormozi's More, Better, New order says to do more of what works until it breaks, then find the step with the biggest drop-off and make it better, testing one thing at a time. That's this whole guide in one sentence.
Key every test. Claude Hopkins was tracking ads with coupons a century ago, judging each one by cost per customer rather than raw replies. UTMs and pixel events are the modern coupon. His summary of why: "Now we let the thousands decide what the millions will do."
Before you scale a winner, stress-test it. Our rule of thumb is 7 days at the planned daily spend on a capped audience, or until you've collected about 50 optimization events, whichever comes first. A result that holds at real spend is a result. One that only held at test budget may have been luck.
For a full testing order, sample-size shortcuts and when to call a test, see our guide to A/B testing low-traffic funnels. To find which stage to test first, run your numbers through the funnel conversion calculator.
Choosing the right funnel shape
Sometimes the leak isn't a stage. It's the shape of the funnel. A $47 offer pushed through a sales call wastes a closer's hour. A $15,000 offer sent straight to checkout asks a cold visitor for too much trust.
Our rule is to let price and trust choose the path: direct checkout for low-ticket offers, a booked call where the buyer needs a conversation, and an application only where the friction improves the calls more than it cuts their number. The trade-offs, and the split test we use to decide, are in checkout, application or booked call.
For reading the page-level benchmarks in more depth, by industry, traffic source and offer type, see what a good landing page conversion rate is in 2026.
If you want us to run that audit on your funnel, book a strategy call.
Common mistakes
- Blending traffic sources. A 12% opt-in rate is excellent from cold Meta and weak from your email list. Averaged together, it tells you nothing.
- Comparing Ads Manager conversion with page conversion. Leads per click and conversions per visitor are different fractions.
- Counting on-demand viewers as show rate. If your benchmark includes replays, yours should too, or neither should.
- Testing before tracking. A test read off double-counted events is a test you'll have to run again.
- Raising spend to "get more data". More traffic into the same leak gives you a more confident answer to the wrong question.
- Redesigning everything at once. If you change five things and conversion moves, you don't know which one did it.
Frequently asked questions
Sources
- 1.2024 Conversion Benchmark Report. Unbounce, 2024-08-29 (modified 2024-09-04).
- 2.Conversion Benchmark Report: methodology. Unbounce, 2024.
- 3.Education landing page conversion rates. Unbounce, 2024-11-05.
- 4.Conversion Benchmark Report 2020. Unbounce, 2020-04-17.
- 5.What's a good conversion rate?. Unbounce, 2025-07-25.
- 6.Facebook advertising benchmarks. LocaliQ / WordStream, 2026-09-23.
- 7.Webinar Benchmark Report 2026. Livestorm, 2026.
- 8.The webinar guide (2026 webinar benchmarks). ON24, 2026.
- 9.2025 B2B Webinar Benchmark Report. Goldcast, 2025.
- 10.Handling duplicate Pixel and Conversions API events. Meta for Developers, accessed 2026-10-04.
- 11.Set up cross-domain measurement. Google Analytics Help, accessed 2026-10-04.
- 12.Clarity FAQ. Microsoft Learn, accessed 2026-10-04.
- 13.Set up consent mode. Google for Developers, accessed 2026-10-04.
- 14.Clarity consent management. Microsoft Learn, accessed 2026-10-04.
- 15.Ways to reduce no-show rates in sales calls. RevenueHero, 2025-08-18 (updated 2026-04-24).
- 16.Traffic but no sales. ClickFunnels, 2026-09-17.
- 17.Why most online courses never sell. Kajabi, 2026-08-05.
- 18.Cart abandonment rate statistics. Baymard Institute, 2025-09-22.
- 19.Clarity semantic metrics. Microsoft Learn, accessed 2026-10-04.
- 20.2026 Email Deliverability Benchmark Report. Validity, 2026-03.
- 21.Lead generation testing: form field length reduces cost per lead. MarketingExperiments (MECLABS), 2011-06-27.
- 22.Email marketing benchmarks. GetResponse, 2024.
- 23.Milliseconds Make Millions. Deloitte / 55 for Google, 2020-03-24.
- 24.Site speed is (still) impacting your conversion rate. Portent, 2022-04-20.
- 25.Akamai online retail performance report: milliseconds are critical. Akamai, 2017-04-19.
- 26.What is a good conversion rate?. WordStream, 2014-03-17.
- 27.Optimizely debuts new report revealing increased rates of experimentation. Optimizely (via PR Newswire), 2023-11-27.
- 28.Stopping A/B tests: how many conversions do I need?. CXL, 2015-02-20 (updated 2022-12-20).
Written by
Ray GillespieCo-Founder & COO
Ray runs day-to-day operations across every Victory engagement, building the systems, automations and AI-powered workflows that hold the machine together. He has overseen operations behind more than $120M in revenue.