Checkout, Application or Booked Call? Matching the Funnel to the Price Point
Below about $1K, send buyers to checkout. Above it, book a call. When an application earns its friction, and the split test that settles it per visitor.
 Devin AlexanderCo-Founder & CEO
Published 10 min read
On this page
Key takeaways
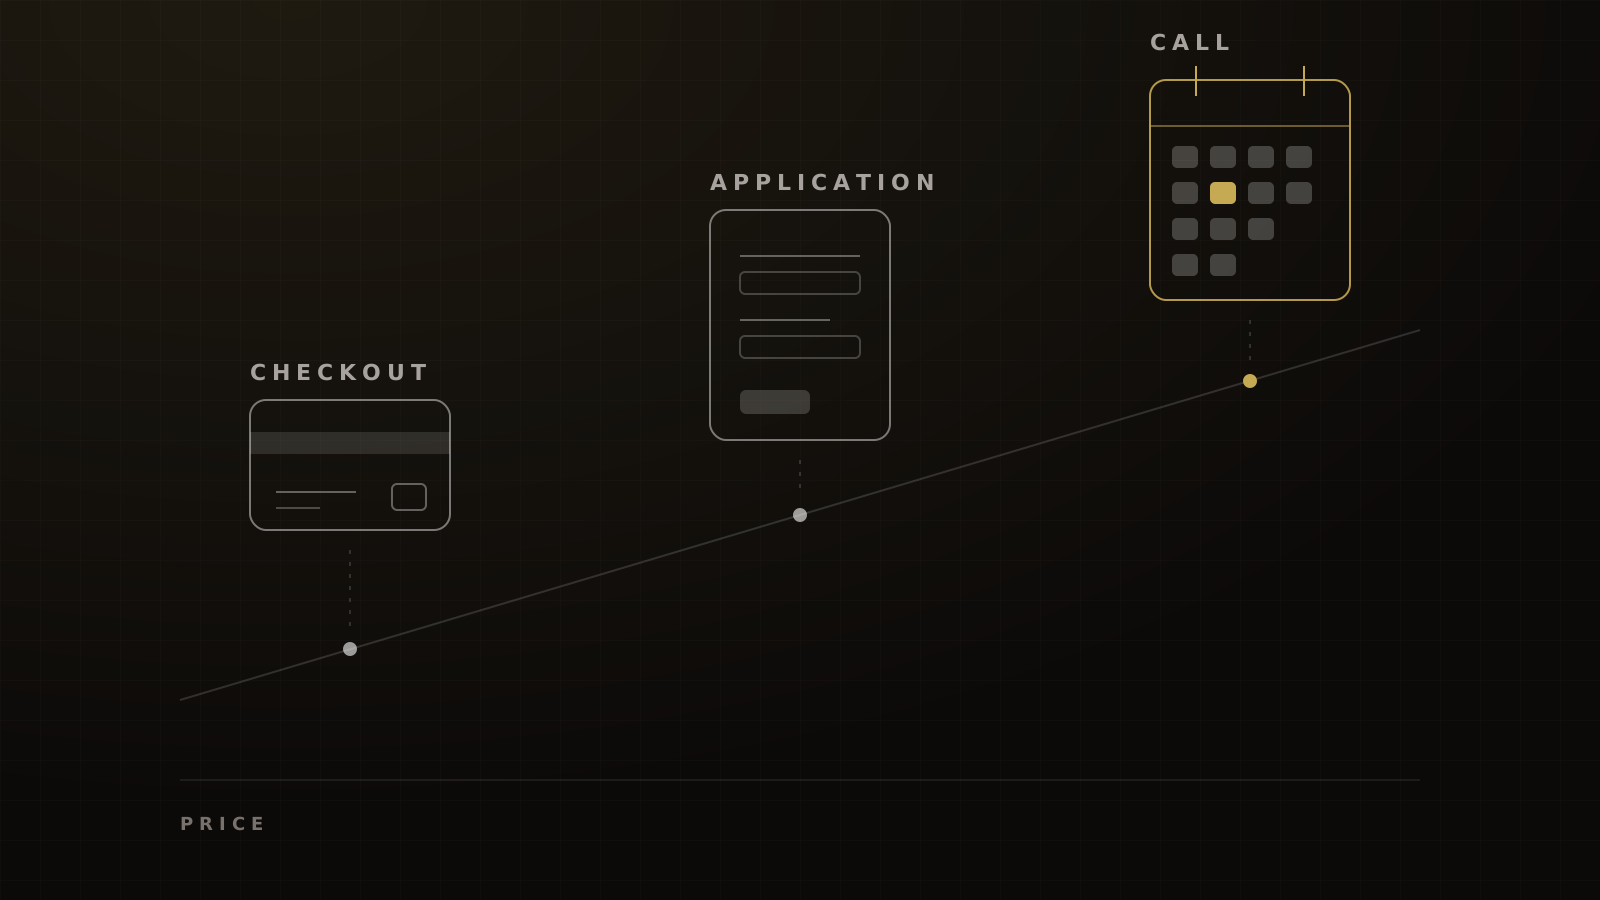
- Let price and trust pick the door. Below about $1K, send traffic to checkout. From about $1K to $50K, book a call. That band is our working rule, not a researched threshold.
- Reps don't pay on cheap tickets. A 10% commission on a $50 sale is $5 for an hour of a closer's time.
- An application is a filter, not a funnel. Add one only when the bad calls it removes cost you more than the bookings it loses.
- Show the calendar the moment the form is submitted. Chili Piper found 66.7% of qualified submissions booked when scheduling was offered right after the form.[1]
- Settle it with a split test judged on revenue per visitor, never on checkout conversion against close rate.
Match the funnel to the price, and to how much trust the buyer needs before they pay. Below about $1K, send traffic straight to checkout, because a closer's hour costs more than the sale is worth. From roughly $1K to $50K, book a call. Add an application only where the friction buys you better calls than it costs you in bookings.
If you don't know which side of the line an offer sits on, test it. Send 20% to 30% of your checkout traffic to a closer's calendar and compare revenue per visitor.
The short answer: let price and trust pick the funnel
| Price | Door | Why | What to measure |
|---|---|---|---|
| Under ~$1K | Direct checkout | A closer's hour costs more than the margin | Purchase rate per visitor, upsell take rate, abandoned-checkout recovery |
| ~$1K to $50K | Booked call | The buyer wants a human, and the commission is worth a closer's hour | Book rate, show rate, close rate on held calls, revenue per visitor |
| Any price, too many poor-fit calls | Add an application | Filters fit before the calendar | Bookings lost against show and close gained |
| Not sure | Split test | Settles it on your own traffic | Revenue per visitor by door |
Our working bands from running these funnels, not a measured study. Test them on your own offer and traffic.
The bands are an operating rule. No public close-rate curve by price exists for coaching or course calls, and nobody has published a controlled test of applications against open calendars. The thresholds in search results have no experiment behind them. LearnyBox, for example, draws the line at $1,000 and cites no dataset.[2]
Trust is the second axis. In a 2025 Invoca survey of 1,000 US and UK consumers who had made a high-stakes purchase, 67% said they preferred a human when human and AI help were equally available.[3] Those were cars, healthcare and finance, not coaching, so read it as direction.
Price isn't the whole story either. On SamCart, products priced at $499 or more were 5% of transactions but 55% of revenue processed.[4] The real question is whether a call adds more revenue than it costs.
Direct to checkout (below ~$1K)
Why reps don't pay here
Run the commission math. The only sourced commission figure we've found is from B2B SaaS: a median of 11.5% of contract value at quota, across 172 companies in the Bridge Group's 2024 survey.[5] Those are B2B SaaS account executives, not commission-only closers, but the arithmetic works at any similar rate. At 11.5%, a $47 sale pays about $5. A $2,500 sale pays about $290.
No good closer takes a 45-minute call for $5. On free events and $50 tickets, we don't put reps on the phone. The ads and the checkout do the selling.
It's very easy to get salespeople when you have quality leads at a good price point.
What good looks like
In our experience, cold traffic to a $7 to $47 sales page buys at 3% to 6%. ClickFunnels estimates 3% to 5% for digital products under $50, 1% to 2% for products over $200 and 1% to 3% for course sales pages. Those are its estimates, with no sample or period published.[6]
Without anyone selling, most leads never buy. Of 36.2 million Kajabi customer relationships that started with something free, 4.0% went on to buy anything.[7]
Two steps, fewer fields
Use a two-step order form. HighLevel's version takes contact details on step one and payment on step two.[8] Anyone who stops at the card field is now a contact you can follow up. Near the top of the band, where a call can rescue a sale worth several hundred dollars, our standard is a first dial in under an hour during staffed hours, and every lead dialed within 24 hours.
Then cut the friction that loses buyers you've already won. Among US shoppers who abandoned a checkout for a reason other than browsing, 40% cited extra costs, 18% being forced to create an account, 17% a long or complicated checkout, and 12% not seeing the total cost up front.[9] The average US checkout shows 23.48 form elements by default. Baymard puts the ideal at 12 to 14.[9] Show the full price and drop the account step.
Booked call ($1K to $50K)
Form first, calendar second
Ask your questions, then show the calendar the instant the form is submitted, not a promise that a setter will call tomorrow.
Chili Piper looked at nearly 4 million form submissions in 2024, mostly B2B. When booking was offered right after the form, 66.7% of qualified submissions booked a meeting. It puts the rate without in-form scheduling at about 30%, but doesn't source that comparison.[1] It's a vendor that sells form scheduling, measuring software demos, so take the direction, not the exact gap. RevenueHero's 2025 data on more than a million inbound forms puts the median qualified-to-booked rate at 62%, and the top 10% at 78%.[10]
Required fields are fine. A serious buyer will spend 60 seconds on a form before a four- or five-figure decision.
Keep the booking window short
In our experience, high-ticket calls booked no more than about three days out show at 82% to 88%. RevenueHero reports an average B2B meeting no-show of 15.9%, and a median of 13.5%.[11] Close slots two weeks out. Our sales call show rate guide covers the reminder sequence that goes with it.
What close-rate data exists
The nearest public figures are B2B. The Bridge Group's median account-executive win rate fell from 23% in 2022 to 19% in 2024.[5] Ebsta and Pavilion put the new-logo win rate at 19% across 655,000 opportunities.[12] Those are opportunity win rates over multi-meeting cycles, not one-call coaching closes. Don't grade a closer against them.
For calls fed by a webinar selling a $1K to $10K offer, our rule of thumb is that 6% to 10% of live attendees buying is good, and 1% to 3% is failing. There's no public benchmark for that.
Plan the calendar's capacity
We never fill a closer's calendar past 75% to 80% of available slots. The spare room takes same-day bookings and rebooked no-shows. Our working assumption, not an industry benchmark, is 4 to 6 high-ticket calls a day per full-time closer at 80% fill.
Application funnels: when friction earns its keep
Russell Brunson's high-ticket application funnel puts a filter in front of the closer. The prospect applies, a setter qualifies them on a short call, and only the qualified ones reach a closer. It's built for when demand outruns closing capacity.
Alex Hormozi makes the general case that friction raises lead quality, and that you add or remove it depending on whether you have too many weak leads or too few leads. In his terms, too few leads is an advertising problem and leads that don't close is a sales problem. An application helps the second and worsens the first.
What it costs
Every question costs volume. In one B2B company's test, forms of 5, 7 and 9 fields converted at 13.4%, 12% and 10%, and cost per lead rose from $31.24 to $34.94 to $41.90.[13] That's one company in 2011, with no lead quality or sales reported: the price of friction, not the payoff. Our target for soft qualifying questions is that 2 to 3 of them cost no more than 10% of submissions. That's a house rule; we've found no credible industry benchmark.
When it pays
Qualification pays when it's fast. RevenueHero found top-quartile performers disqualify 37.7% of submissions, against 18.7% for the bottom quartile, and still book more of the people they keep.[10] That's an association, not proof of cause. Chili Piper found 14.1% of demo form submissions were disqualified outright: spam, personal emails or off-criteria.[1] The lesson from both is the same. Qualify hard, then let the qualified buyer book on the spot.
Ask financial-fit questions in a lawful way and use lawful third-party data. Never publish income or credit cutoffs. If the offer touches credit, employment or housing, Meta's special ad categories also limit how you can target the ads that feed it.
When it backfires
Applications on free events are friction with no payoff. Use a couple of factual questions and a verified phone and email instead.
Low-ticket buyers need a different gate. After a cheap purchase, we put the booking button after the first training video, not on the thank-you page. Our thank-you page guide covers the layout. Ray put the trade-off plainly: "we might get fewer booked calls from here, but they'll be less confused when they show up."
The split test: checkout vs closer calendar
Our standard split sends 20% to 30% of direct-to-checkout traffic to a closer's calendar instead, and leaves the rest on checkout.
There's a reason a closer door belongs beside checkout even when checkout works. On the $1K to $10K webinar offers we run, 40% to 60% of sales close through the "talk to a closer" door rather than pay-now checkout. That's our experience; we know of no industry benchmark.
Judge on revenue per visitor
The usual comparison is wrong. LearnyBox sets self-serve checkout at 1% to 3% of page visitors beside sales calls at 30% to 50% of completed calls, with no dataset behind either.[2] Those are two different denominators. One counts visitors. The other counts people who already applied, booked and showed up. Bring both back to the visitor.
| Line | Checkout door | Closer door |
|---|---|---|
| Visitors | 1,000 | 1,000 |
| Booked calls | n/a | 80 (8%) |
| Calls held | n/a | 68 (85% show) |
| Sales | 10 (1.0% of visitors) | 17 (25% of held calls) |
| Revenue | $20,000 | $34,000 |
| Closer commission (10%) | $0 | $3,400 |
| Net revenue per visitor | $20.00 | $30.60 |
Every figure here is hypothetical, chosen to show the math. Swap in your own rates, price and commission.
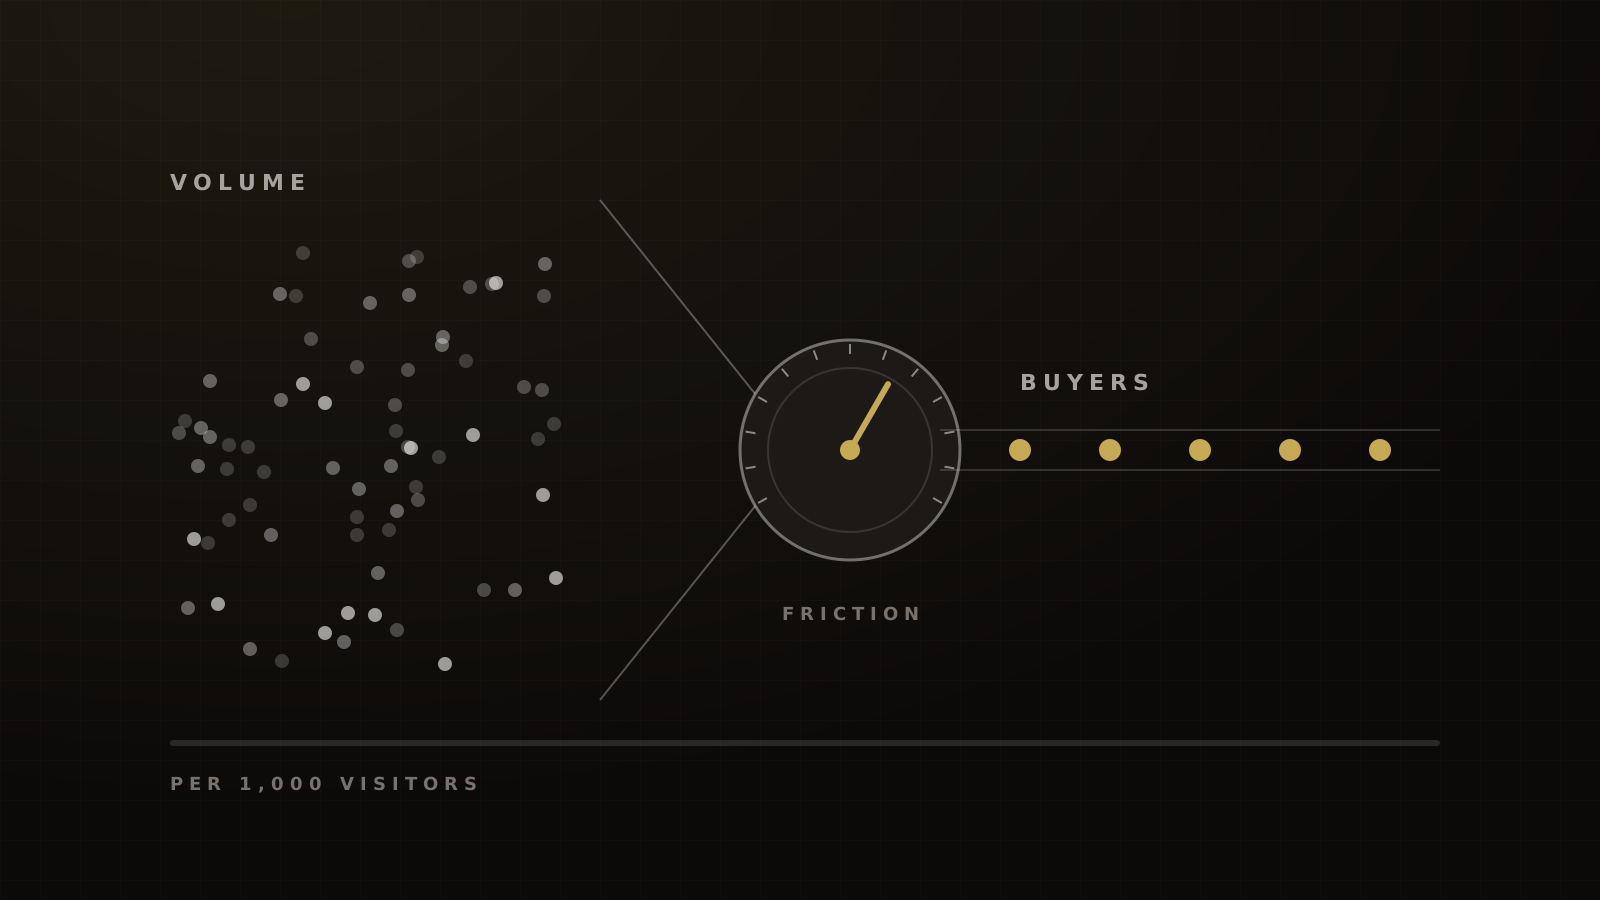
On a "conversion rate" view, checkout's 1% looks hopeless next to the closer's 25%. Per visitor, the closer door sold 1.7% against 1.0%, and still won after commission. At a $400 price, the closer earns $40 a sale, about $10 per call held, and no good closer stays for that. That's the price band, worked out on your own numbers.
Run it long enough
Most tests don't produce a winner. Across more than 127,000 experiments on its platform, Optimizely found 12% produced a statistically significant win on the primary metric.[14] A handful of sales per door tells you nothing yet. Our A/B testing guide covers sample size, and the funnel conversion calculator runs revenue per visitor for each door.
Mistakes we see
- Reps on $50 tickets. The commission can't pay for the hour.
- The six-figure price on the page. For the biggest offers, the number belongs on the sales call, after the buyer has seen what it buys.
- Long applications for cold traffic. A stranger from an ad won't answer twelve questions for a call they weren't sure they wanted.
- Comparing checkout conversion with close rate. Different denominators. Bring both back to revenue per visitor.
- "We'll be in touch." A form without a calendar loses qualified buyers at their most interested.
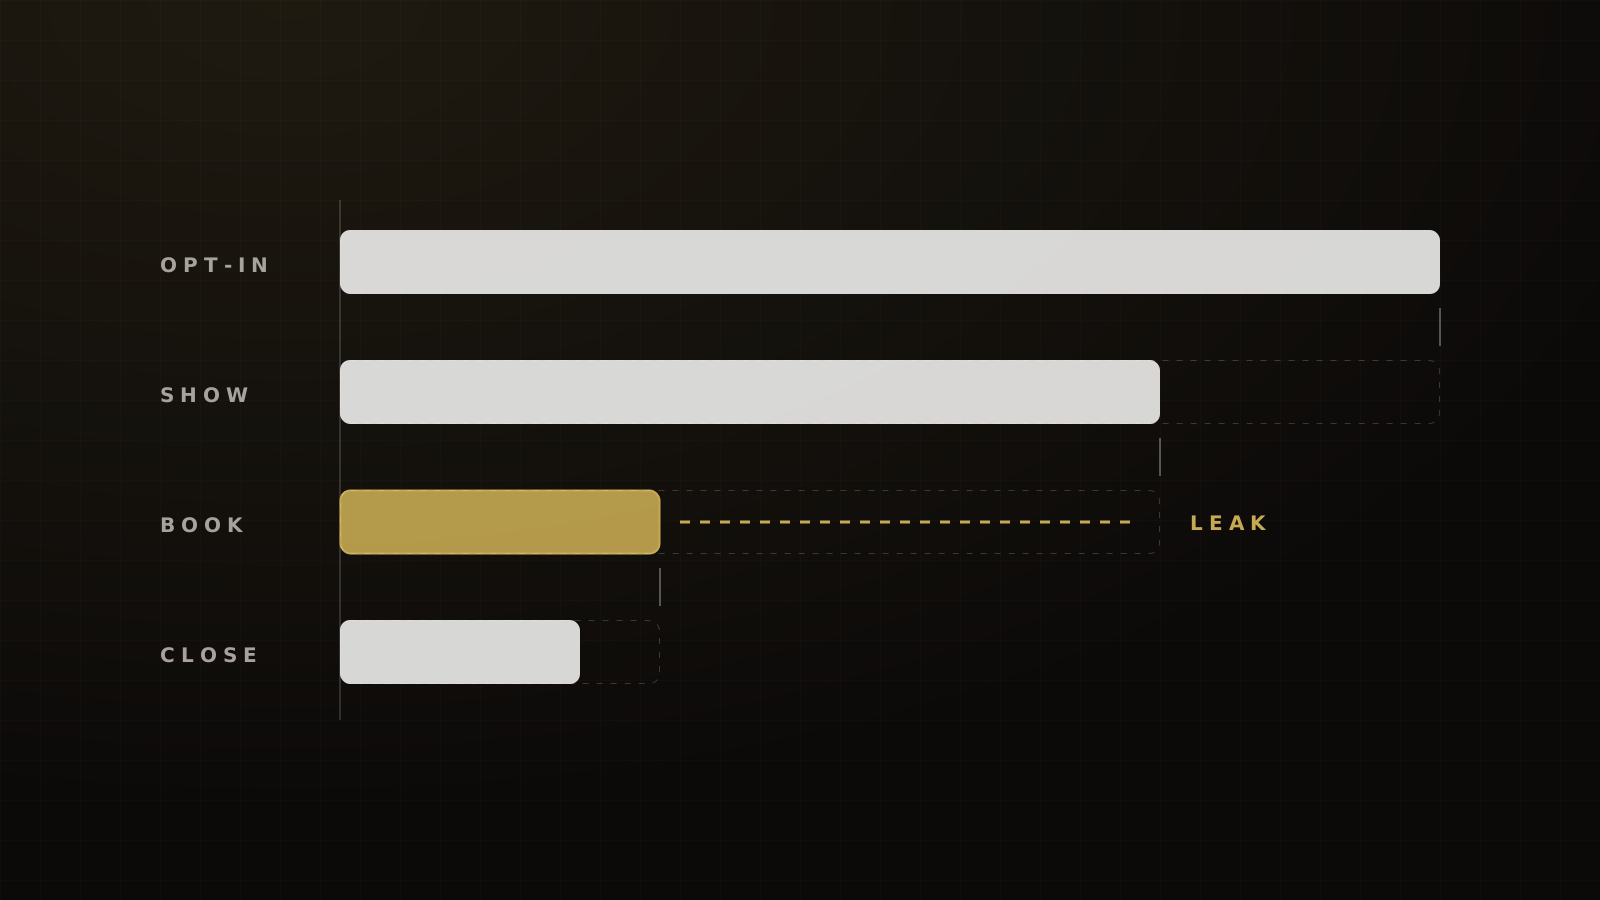
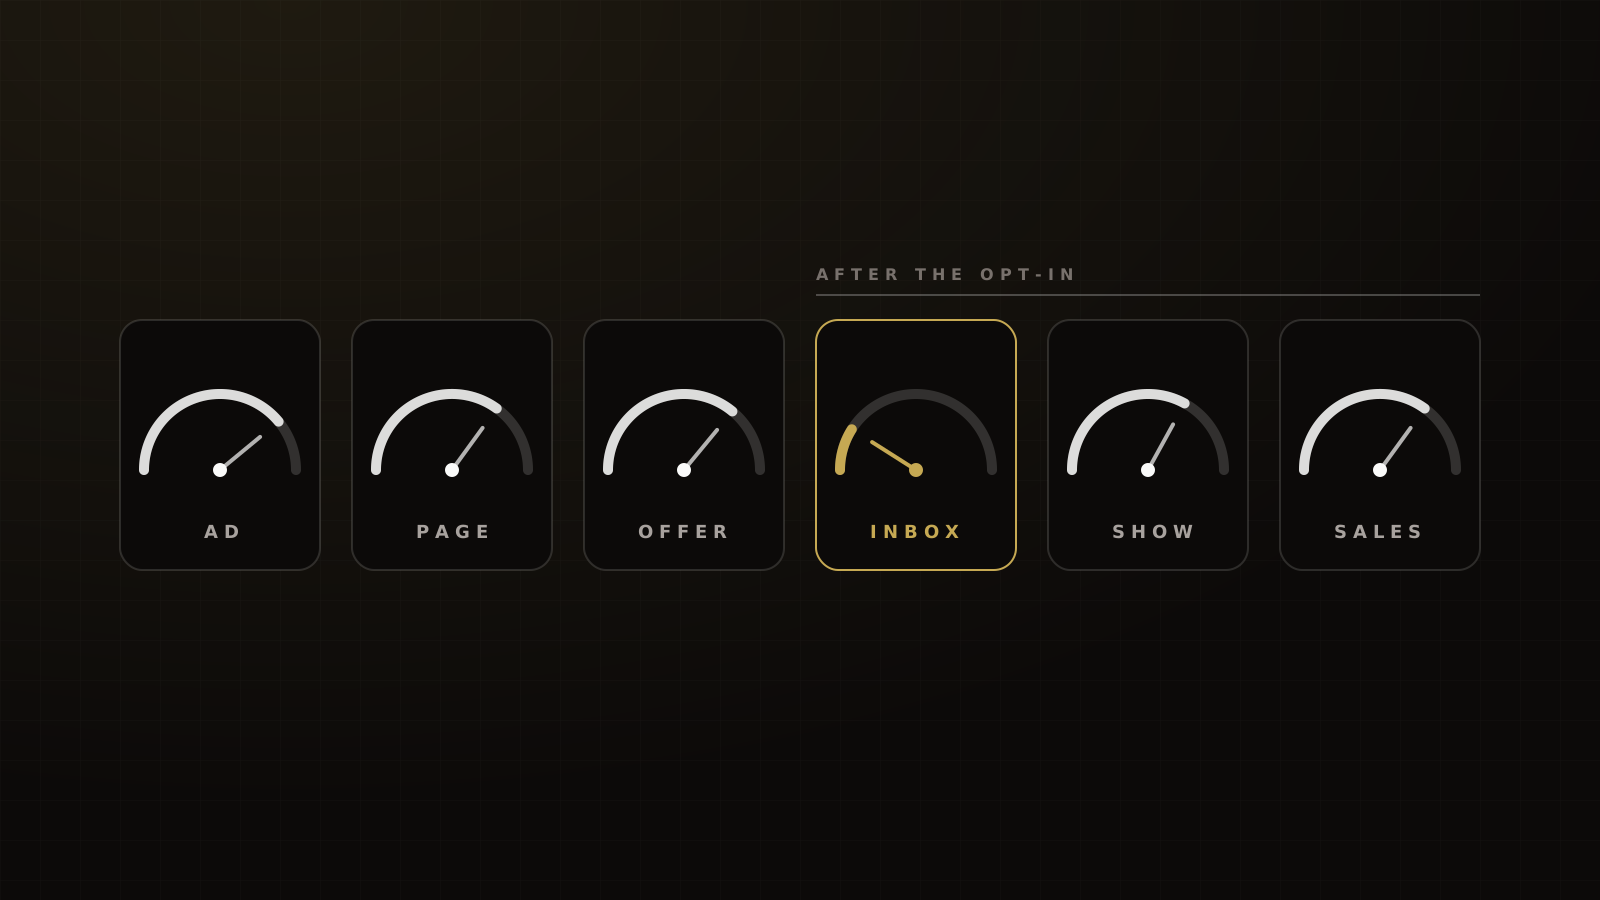
For stage benchmarks, start with our funnel CRO guide. For where friction belongs, see where should the friction go. If you can't tell which stage leaks, run the funnel diagnostic. To staff the calls, see our high-ticket sales team guide. To pressure-test the price band on your own offer, book a strategy call.
Frequently asked questions
Sources
- 1.2025 Benchmark Report on Demo Form Conversion Rates. Chili Piper, 2025-02-18, updated 2025-09-26.
- 2.How to sell an online course through a sales call. LearnyBox, 2026-09-11.
- 3.B2C Buyer Experience Report 2025 (press release). Invoca, via PR Newswire, 2025-07-24.
- 4.Creator Profits Report. SamCart, 2023.
- 5.SaaS AE Metrics & Compensation, v9.3. The Bridge Group, 2024-03.
- 6.Traffic but no sales. ClickFunnels, 2026-09-17.
- 7.Why most online courses never sell. Kajabi, 2026-08-05.
- 8.Two-step order form. HighLevel Support Portal, 2026-09, accessed 2026-10-04.
- 9.Cart abandonment rate statistics. Baymard Institute, 2025-09-22.
- 10.2025 Inbound Conversion Benchmark. RevenueHero, 2026-02.
- 11.Ways to reduce no-show rates in sales calls. RevenueHero, 2025-08-18, updated 2026-04-24.
- 12.2025 GTM Benchmarks Report. Ebsta x Pavilion, 2025-03.
- 13.Lead generation testing: form field length reduces cost per lead by 10.66%. MarketingExperiments (MECLABS), 2011-06-27.
- 14.Optimizely debuts new report revealing increased rates of experimentation. Optimizely, via PR Newswire, 2023-11-27.
Written by
Devin AlexanderCo-Founder & CEO
Devin architects Victory's revenue systems: team structure, comp plans, scripts and the accountability frameworks that make sales floors predictable. He has generated more than $150M in sales and trained more than 250 closers.
Part of the guide: Funnel CRO: Benchmarks, Diagnostics and Tests for Coaching, Course and Event Funnels