Funnel Conversion Rate Calculator: Opt-In, Show, Booking and Close Rates to Revenue per Lead
Work out each funnel stage rate, revenue per lead and revenue per visitor, then find the one stage whose fix adds the most revenue at your current spend.
 Ray GillespieCo-Founder & COO
Published 9 min read
On this page
Key takeaways
- A stage's conversion rate is the people who completed it divided by the people who reached it. Multiply the stages together and by average order value to get revenue per lead.
- In a chained funnel, a 10% relative lift at any stage adds the same 10% to revenue. So the stage to fix first is the one with the most room below its target.
- Use benchmark defaults only as placeholders, and know each one's denominator. No reliable public benchmark exists for close rate on coaching calls, so that input has to be yours.
- Report every stage by traffic source, with a target next to every actual. Blended numbers hide the leak.
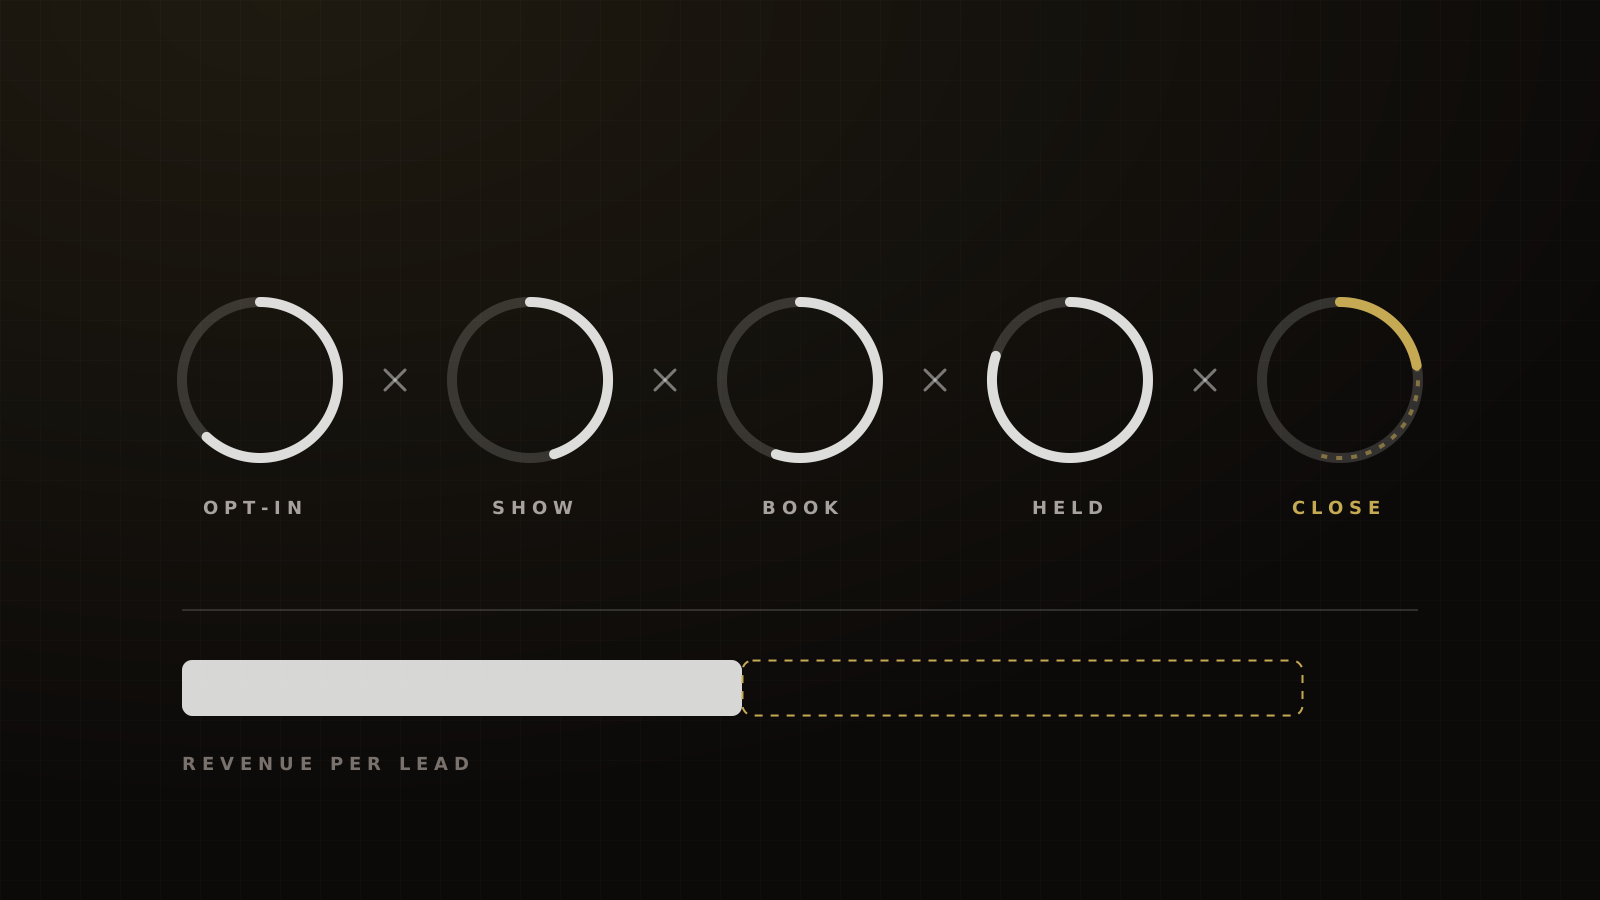
Each funnel stage's conversion rate is the number of people who completed that step divided by the number who reached it. Revenue per lead is total revenue divided by leads, which in a chained funnel equals show rate × booking rate × held rate × close rate × average order value.
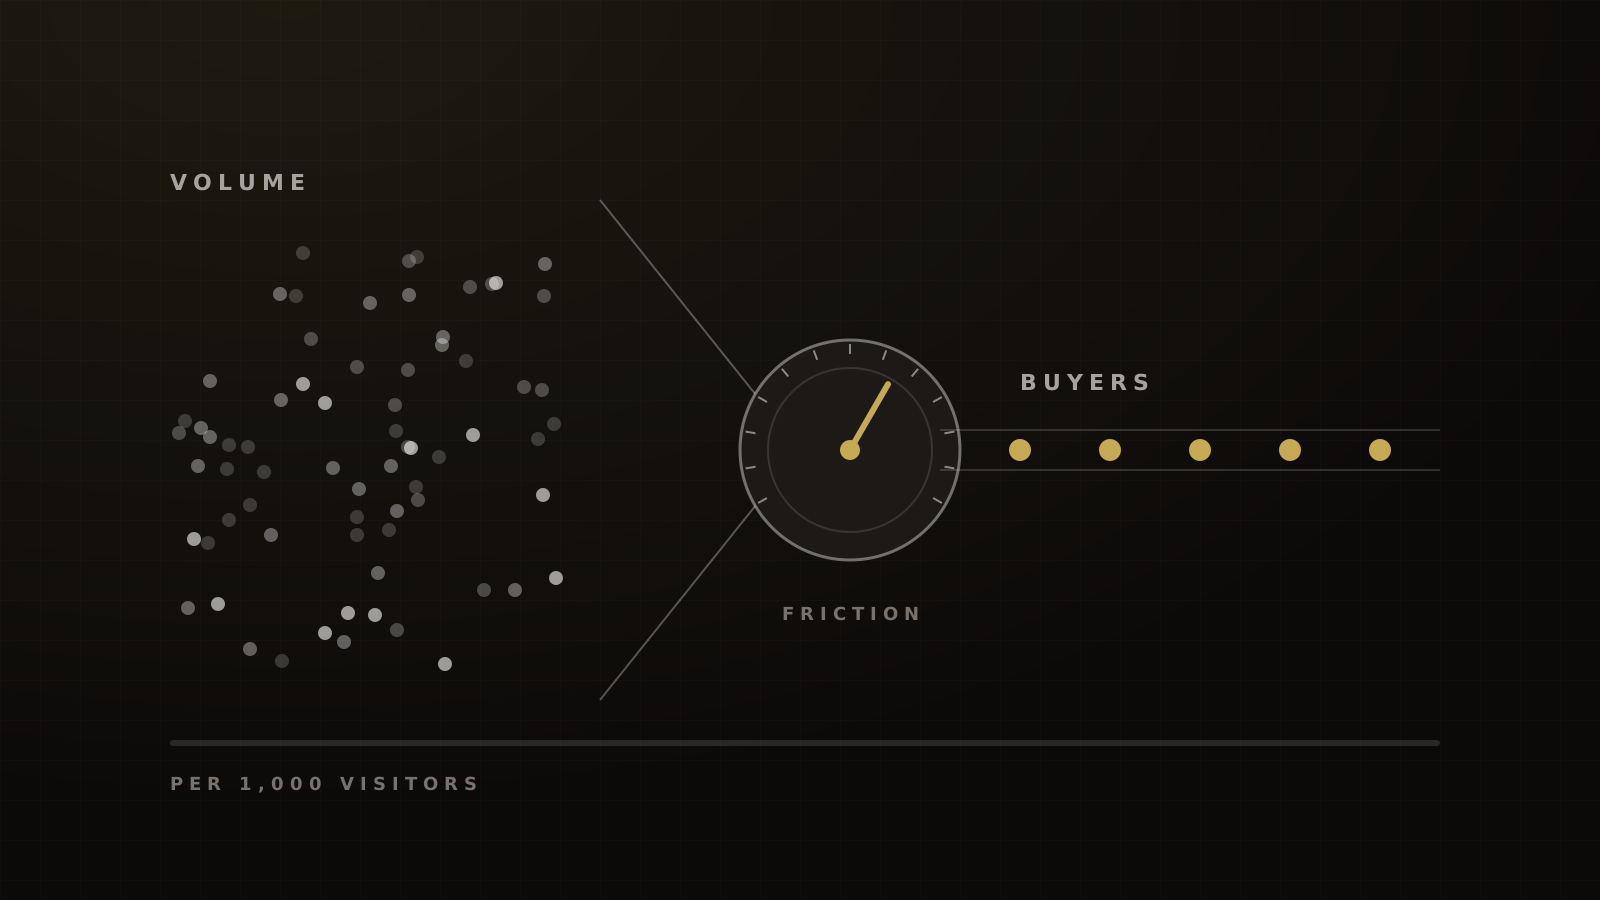
This calculator multiplies your stage rates through to revenue per lead and revenue per visitor. Then it does the part most calculators skip: it shows which single-stage fix adds the most revenue at your current ad spend.
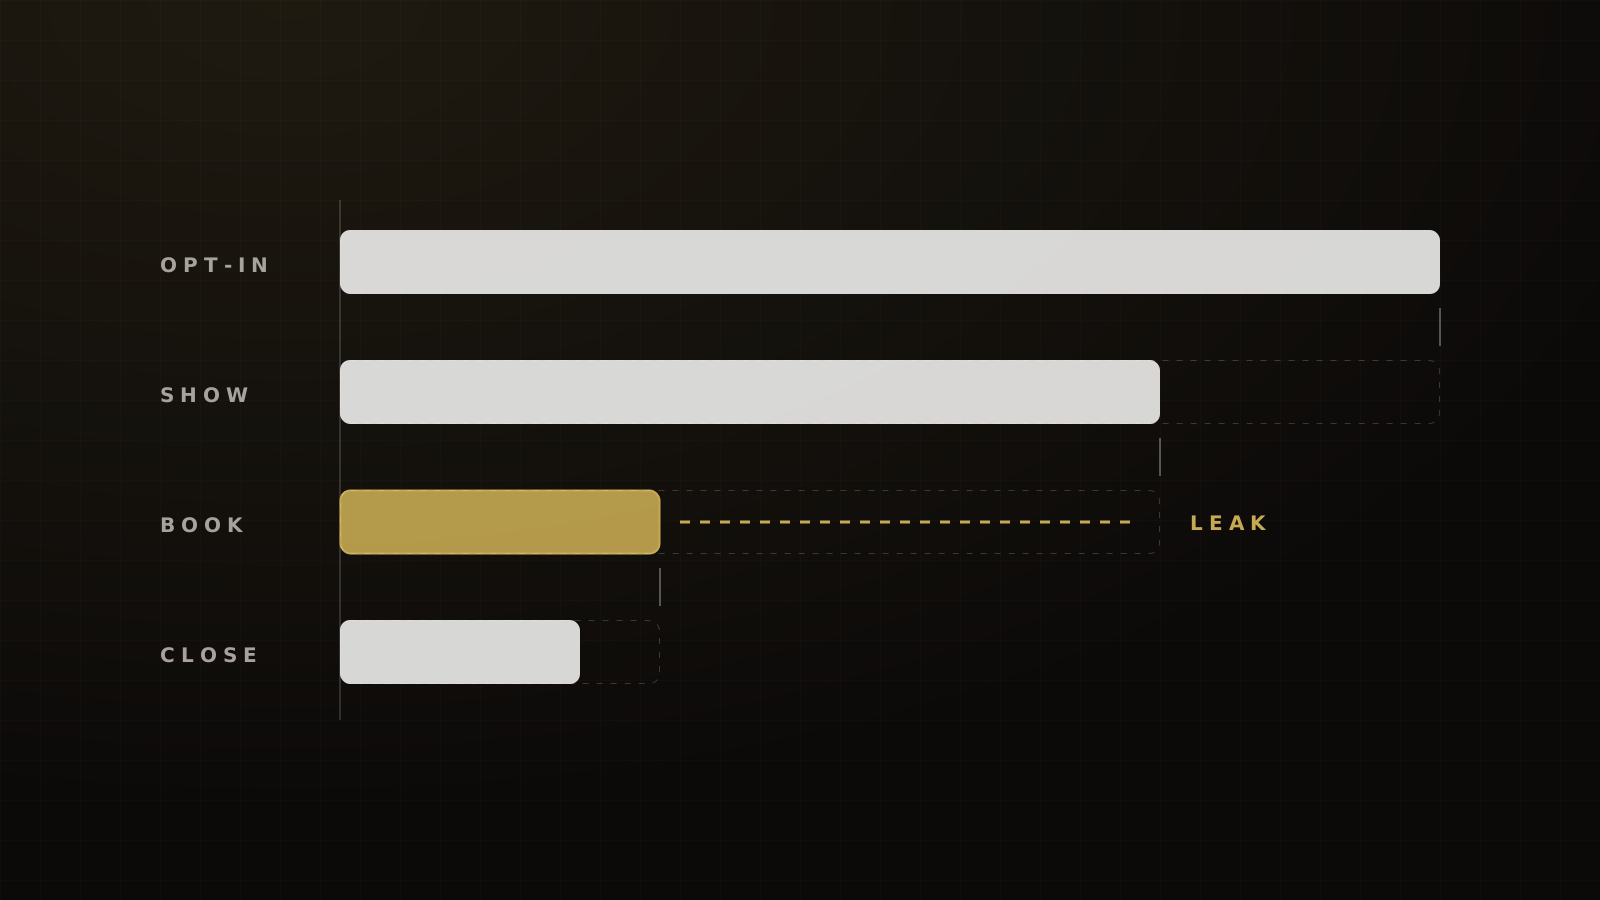
The answer is usually not the opt-in. It's the stage furthest below its target.
The calculator
Chaining stage rates isn't new. Several webinar calculators already do it. LaunchWebinars presets $8 per registrant, 33% show, 25% of attendees booking and 20% of calls closing, labelled as averages but with no source given.[1] Jeremy Haynes' model chains registrants through show, booked call, call show and close, and says its inputs default to realistic benchmarks, again without sources.[2]
What's different here: every default has a source, a date and a denominator, and the output ranks your stages by what fixing each one is worth.
Fill in your actuals with your own numbers, by traffic source. Use the targets to set what good looks like. Run it separately for cold and warm traffic. A blended version will point you at the wrong stage.
Calculator
Funnel conversion calculator
Multiply your stage rates through to revenue per lead and per visitor, then see which stage is worth fixing first.
Example inputs. Replace with your numbers.
Revenue per lead
$15.75
$28,350 from 9.5 buyers and 1,800 leads
- Revenue per visitor
- $2.84
- Fix firstHitting 25% adds $7,088
- Show rate
- A 10% lift at any one stageSame at every stage, because the stages multiply
- +$2,835
- Booked calls
- 54
- Front-end ROAS
- 1.05x
- Cost per booked call
- $500
Stages ranked by room to target
| Stage | Target ÷ actual | Adds at target |
|---|---|---|
| Show | 1.25 | +$7,088 |
| Opt-in | 1.22 | +$6,300 |
| Held | 1.17 | +$4,860 |
| Booking | 1.00 | At target |
| Close | 1.00 | At target |
Raising the opt-in rate raises revenue but not revenue per lead. Every other stage raises both.
How this is calculated
- Leads = visitors × opt-in rate
- Buyers = leads × show rate × booking rate × held rate × close rate
- Revenue = buyers × average order value
- Revenue per lead = revenue ÷ leads; revenue per visitor = revenue ÷ visitors
- A 10% relative lift at any stage adds 10% to revenue, so stages are ranked by room: target ÷ actual
- Adds at target = revenue × (target ÷ actual − 1), one stage at a time
- Front-end ROAS = revenue ÷ ad spend; cost per booked call = ad spend ÷ booked calls
Estimates for planning, not a promise of results. The example inputs are illustrations, not Victory client results.
Two definitions matter more than they look.
Held rate uses only bookings whose date has passed. A booking for next Tuesday hasn't had the chance to no-show yet. Leave it in the denominator and your held rate looks worse than it is.
Close rate needs a window and a definition of "sale". Signed, deposit paid or cash collected are three different numbers. Pick one and keep it.
The formulas
Framework
Funnel math, stage by stage
- Stage conversion rate = completed the step ÷ reached the step × 100.
- Leads = visitors × opt-in rate.
- Buyers = leads × show rate × booking rate × held rate × close rate.
- Revenue per lead = buyers × average order value ÷ leads.
- Revenue per visitor = revenue per lead × opt-in rate.
- Cost per booked call = ad spend ÷ booked calls.
- Front-end ROAS = revenue ÷ ad spend, for the same window and traffic.
Revenue per lead and per prospect follow Alex Hormozi's value grid, where the back end tells you what you can afford to pay for a lead.
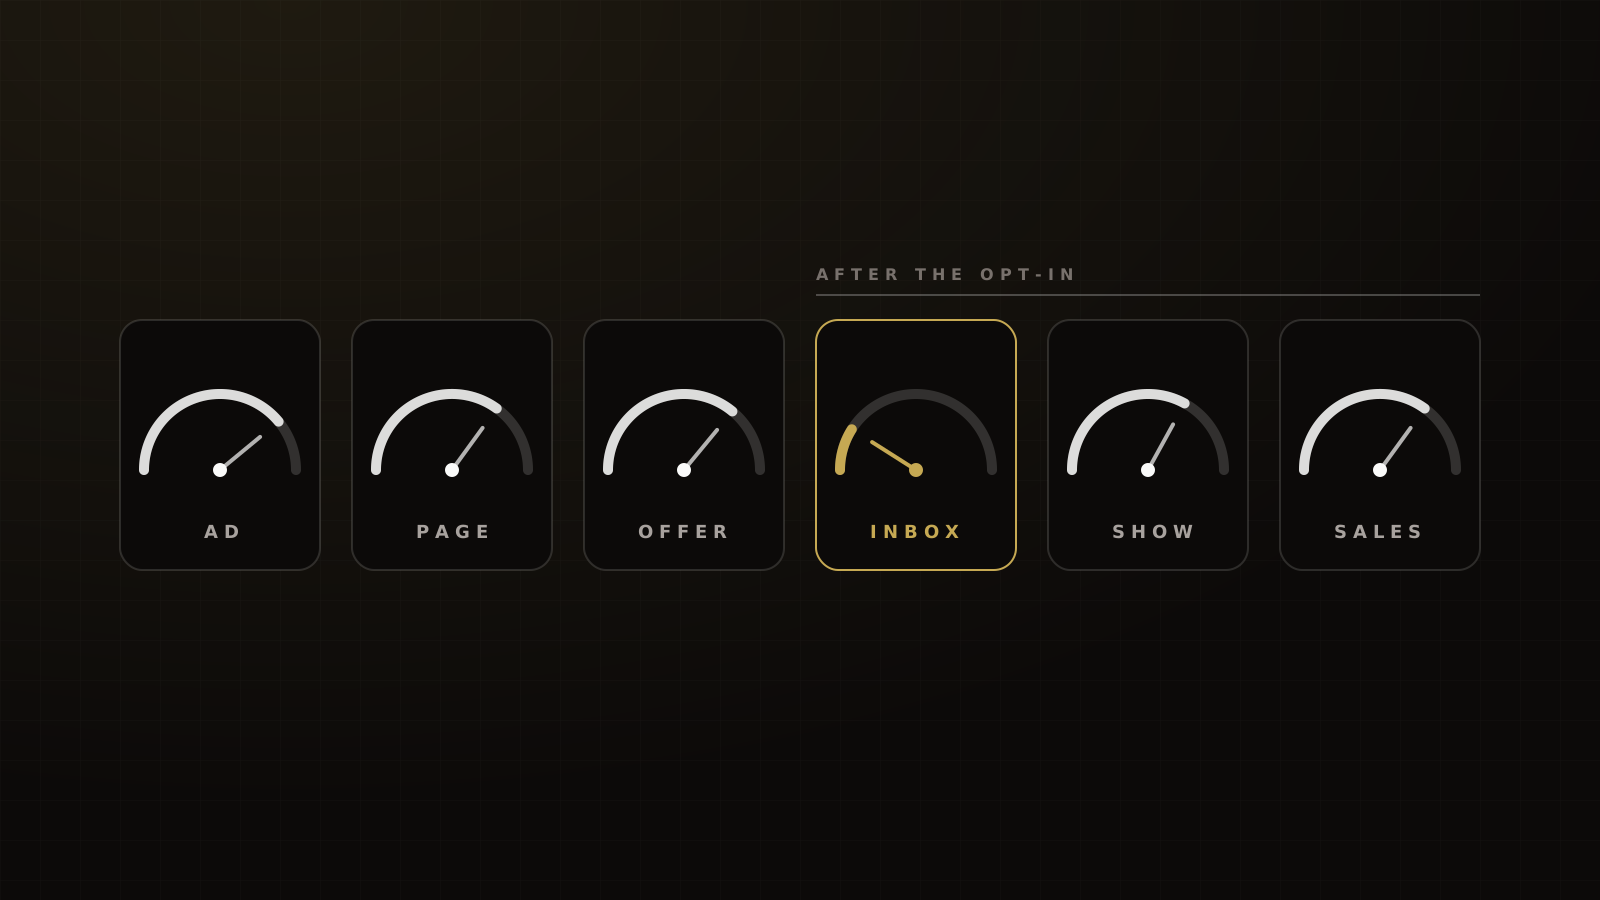
One rule falls out of the multiplication. Raising the opt-in rate at fixed traffic raises revenue, but it doesn't raise revenue per lead. Every other stage does. That's why a funnel can grow its lead count and still lose money: the leads are worth less.
How to read the "fix first" result
In a pure chain, every stage multiplies the next. So a 10% relative lift at any stage adds exactly 10% to revenue. Raising show rate from 20% to 22% is worth the same as raising close rate from 25% to 27.5%.
That means the ranking isn't about which stage matters most. They all matter equally. It's about which stage has the most room. For each stage, divide your target by your actual. The stage with the biggest ratio is the one where closing the gap adds the most revenue.
Then weigh the cost. A confirmation page and a reminder sequence cost less than a new offer. If two stages have similar room, fix the cheaper one first.
This is Alex Hormozi's More, Better, New order applied to a funnel. Do more of what works until it breaks. Then find the step with the biggest drop-off and make it better, one change at a time. In $100M Leads he puts it simply: "I test one thing per week per platform." Only add something new when more and better stop paying.
It's also why the cheapest fix often isn't the page. Claude Hopkins judged every ad by cost per customer, not by replies. Judge every fix by revenue per lead, not by the stage rate it moved.
Every person that clicks that doesn't book an appointment, that doesn't come to an event, that's just burning money.
Where the default numbers come from
If you don't have a number yet, these are the best published placeholders we could verify. Every one comes from a different population, so overwrite each with your own data as soon as you have it.
| Stage | Public default | Denominator and caveat | Victory target |
|---|---|---|---|
| Opt-in, cold paid social | 5.1%[3] | Education landing pages, 2024 | 22–30% (webinar or event registration page) |
| Opt-in, email traffic | 14.1%[3] | Education pages; all industries 19.3% average[4] | 25–35% |
| Leads per click, Meta | 15.87%, $26.31 CPL[5] | Ads Manager leads ÷ clicks, can include instant forms | Not a page rate |
| Webinar show, live | 47.7%[6] | Live attendees ÷ registrants, 2025 | Cold paid 25–35%; warm list 40–50% |
| Webinar attendance, B2B | 40%[7] | 26,190 B2B webinars, 2025, mostly house lists | |
| Attendance incl. on-demand | 60%[8] | Includes replays; reference only | |
| In-person free one-day event show | none published here | 35–45% | |
| Booked → held | about 86.5% (13.5% median no-show)[9] | B2B demos, high-volume teams | 82–88%, booked no more than ~3 days out |
| Live attendee → buyer ($1K–$10K offer) | no reliable public benchmark | 6–10%; 1–3% is failing | |
| Close rate on held calls | leave blank | No method-disclosed public benchmark for coaching calls | Your own number |
| Free lead → any purchase | 4.0%[10] | Kajabi relationships that started free | Reference only |
| Checkout abandonment | 70.22%[11] | Mean of 50 ecommerce studies | Reference only |
Public defaults are cross-industry or platform data, not coaching benchmarks. Victory targets are our operating ranges from experience, not a dataset.
The close-rate cell stays blank on purpose. We couldn't find a published close rate for cold-traffic, high-ticket coaching calls with a disclosed method. A calculator that fills it in for you is guessing.
Worked example (illustration, not a client result)
Say a webinar funnel gets 10,000 cold visitors in a month and sells a $3,000 offer through calls. The numbers below are made up to show the math.
| Stage | Rate | People | Target | Room (target ÷ actual) |
|---|---|---|---|---|
| Visitors | 10,000 | |||
| Opt-in | 18% | 1,800 | 22% | 1.22 |
| Live show | 20% | 360 | 25% | 1.25 |
| Booked call | 15% | 54 | ||
| Held | 70% | 37.8 | 82% | 1.17 |
| Close | 25% | 9.45 | ||
| Attendee → buyer | 2.6% | 6% | 2.3 |
Every figure is hypothetical. Targets use the low end of our ranges.
At $3,000 a sale, that's $28,350 of revenue: $15.75 per lead and about $2.84 per visitor. If the ad spend was $27,000, front-end ROAS is about 1.05 and each booked call cost $500.
Now raise each stage to its target, one at a time:
- Opt-in to 22%: revenue rises to $34,650 (+$6,300).
- Show to 25%: revenue rises to $35,438 (+$7,088).
- Held to 82%: revenue rises to $33,210 (+$4,860).
- Attendee → buyer to 6%: revenue rises to $64,800 (+$36,450).
The page and the show rate are slightly below target. The sales side is far below it: 2.6% of attendees buying sits in what we'd call failing. The fix is the offer, the pitch, the booking step or the calls, not more traffic and not a new landing page. That's the answer most founders don't expect.
Common mistakes
Blending traffic sources. Cold and warm traffic convert at different rates at every stage. A blended sheet averages a strong warm stage with a weak cold one and hides both.
Counting on-demand viewers as show rate. ON24's 60% includes people who watched later.[8] If your benchmark includes replays and your number doesn't, you'll chase a gap that isn't there.
Reading leads per click as page conversion. Meta's 15.87% for Education lead campaigns is leads per click in the ad account.[5] It's not what your page converts.
Getting the booking denominator wrong. In Chili Piper's mid-market data, 36% of all form submissions booked a meeting, but 62% of qualified submissions did.[12] Same funnel, two booking rates. Say which one you mean.
Getting the held denominator wrong. In one week of RevenueHero meetings, 76.1% were completed and 6.5% were no-shows. The two don't add to 100% because future and cancelled meetings stayed in the denominator.[13]
Using a mean as a default. Unbounce's 2020 data produced a 3.2% median and a 9.7% mean for the same pages.[14] The mean looks friendlier and is less typical.
Judging a webinar on live-night sales. In our experience, 30% to 50% of a webinar's sales close after the live session, through the replay and the follow-up window. That's our rule of thumb; there's no industry benchmark for it. Cut the sheet off at the end of the webinar and you'll undercount the close stage.
Stopping follow-up too early. The "eight touches to close a sale" line is a misquote. RAIN Group's survey of 489 sellers found an average of 8 touches to get an initial meeting or other conversion, not a sale.[15]
Stage-by-stage benchmarks from other industries won't map either. First Page Sage reports B2B SaaS stage rates such as 39% lead to MQL and 37% opportunity to close, from undisclosed agency client data.[16] They're useful for seeing how stage denominators chain, not as targets for a webinar funnel.
Where to go next
Once you know which stage to fix, the stage guides take over. For the page, see what a good landing page conversion rate is. For a stage-by-stage check of where the leak sits, run the funnel diagnostic. Before you call a test, read A/B testing for low-traffic funnels. If the leak is the webinar itself, start with our webinar funnel guide.
The full framework, from tracking checks to testing order, is in our funnel CRO guide. And if you'd rather we run the numbers with you, book a strategy call.
Frequently asked questions
Sources
- 1.Webinar calculator. LaunchWebinars, accessed 2026-10-04.
- 2.Webinar calculator. Jeremy Haynes, accessed 2026-10-04.
- 3.Education landing page conversion rates. Unbounce, 2024-11-05.
- 4.2024 Conversion Benchmark Report. Unbounce, 2024-08-29 (modified 2024-09-04).
- 5.Facebook advertising benchmarks. LocaliQ / WordStream, 2026-09-23.
- 6.Webinar Benchmark Report 2026. Livestorm, 2026.
- 7.2026 B2B Webinar Benchmark Report. Goldcast, 2026.
- 8.The webinar guide (2026 webinar benchmarks). ON24, 2026.
- 9.Ways to reduce no-show rates in sales calls. RevenueHero, 2025-08-18 (updated 2026-04-24).
- 10.Why most online courses never sell. Kajabi, 2026-08-05.
- 11.Cart abandonment rate statistics. Baymard Institute, 2025-09-22.
- 12.2026 Web Conversion Benchmark: Mid-Market. Chili Piper, 2026.
- 13.No-show benchmark report, week of December 2, 2024. RevenueHero, 2024-12-13.
- 14.Conversion Benchmark Report 2020. Unbounce, 2020-04-17.
- 15.How many touchpoints does it take to make a sale?. RAIN Group, last updated 2026-06-11.
- 16.Sales funnel conversion rate benchmarks report. First Page Sage, 2026-08-10.
Written by
Ray GillespieCo-Founder & COO
Ray runs day-to-day operations across every Victory engagement, building the systems, automations and AI-powered workflows that hold the machine together. He has overseen operations behind more than $120M in revenue.
Part of the guide: Funnel CRO: Benchmarks, Diagnostics and Tests for Coaching, Course and Event Funnels