Where Should the Friction Go? Card Up Front vs Free Trial vs a Small Paywall
Friction is a dial, not a defect. Where a price, a card or a qualifying question raises buyer quality enough to beat the volume you lose.
 Ray GillespieCo-Founder & COO
Published 10 min read
On this page
Key takeaways
- Friction is a dial, not a defect. Free gets the most sign-ups. A price, a card or a qualifying question filters out people who were never going to buy or show up.
- Free events had a median no-show of about 28%, against about 17% for paid events, across 1,070+ events.[1]
- Price filters. Extra form steps mostly just lose people. In 2026 data from 860+ events, registration friction didn't predict attendance once price was accounted for.[2]
- Most of that gap is screening, not commitment. A price changes who signs up far more than it changes how hard they try.
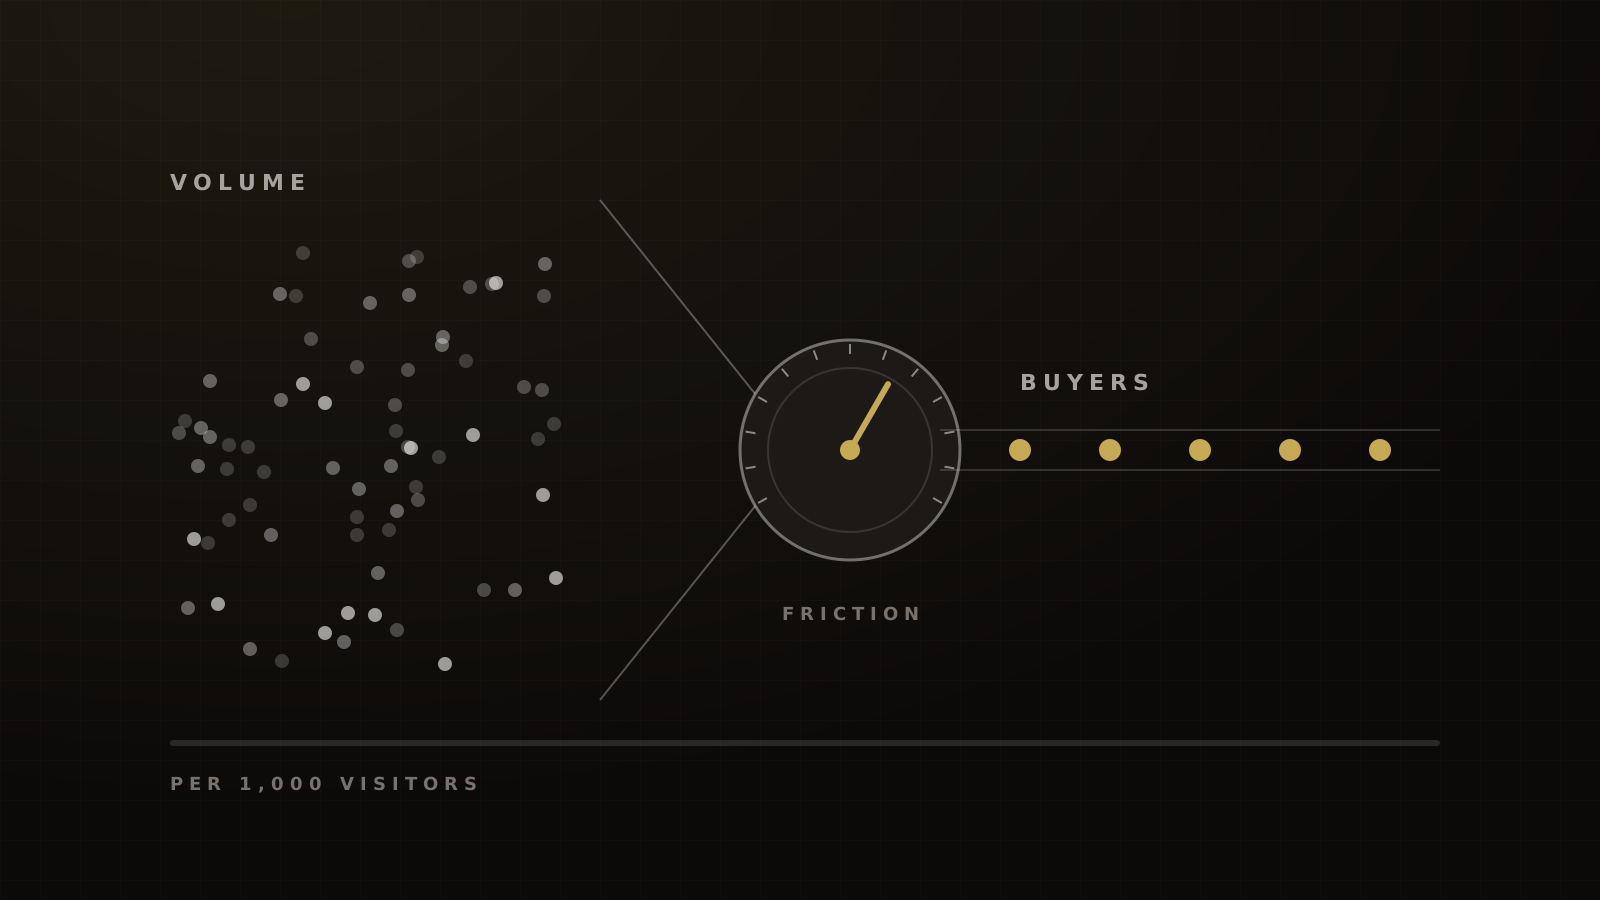
- Judge every friction change on buyers or attendees per 1,000 visitors, never on opt-in rate.
Friction is a dial, not a defect. Free gets you the most sign-ups. Any price, card or question filters out some of the people who were never going to buy or show up, and it also filters out some who would have.
The job is to put friction where buyer quality matters more than the volume you lose. On the funnels we run, that means a small price on an event ticket, a card on file for a warm masterclass audience, and a few factual questions before a sales call. Cold-traffic registration stays light.
What friction buys you, and what it costs
Start with the cost, because it's large. Researchers have shown that demand jumps disproportionately when an option becomes free rather than just cheap.[3] Alex Hormozi builds his case for friction on that "penny gap" research. Free is a different category, not a lower price.
In one randomized field experiment, raising a product's price from $0 to $0.75 cut uptake by 75%.[4] A tiny price is not a tiny filter.
Screening, not commitment
The common belief is that paying makes people try harder. The evidence says something narrower.
A field experiment in Zambia priced the same product at different levels and separated two effects. Higher prices selected households that were more likely to use the product. Paying more did not make buyers use it more.[5] In the Kenyan experiment, people who got the product free were no less likely to use it than people who paid.[4]
Event data says the same thing. PheedLoop's median no-show was about 28% for free events and 17% for paid ones.[1] But inside the same event, paying guests attended only 2 to 4 percentage points more reliably than comped guests, and they did better in 57% to 65% of those events.[2]
That's the distinction the top results miss. A price works mostly as a screen on who comes in, not as a commitment device on the people already in. So you add friction to change the mix of people, and you judge it on whether the mix that's left buys.
Median no-show at free events vs paid events, across 1,070+ live events
In our experience, the contrast is sharper for consumer events that sell from stage. A free one-day in-person event run well shows 35% to 45% of registrants. A paid VIP ticket in the $100 to $297 range shows 85% to 90%, against PheedLoop's roughly 83% check-in at paid events.[1] Free and long is worse still: on a free three-day event, we typically see only 10% to 15% of unique registrants attend at least one day.
What it costs in volume
Form length shows the volume side clearly. In one B2B company's test, forms of 5, 7 and 9 fields converted at 13.4%, 12% and 10%, and cost per lead rose from $31.24 to $34.94 to $41.90.[6] It reported no lead quality or sales, only that longer forms cost more per lead.
Free volume isn't clean volume either. Chili Piper found 14.1% of B2B demo form submissions were disqualified: spam, personal emails or off-criteria.[7]
And money doesn't fix everything. A randomized trial across 6,746 outpatient appointments in Denmark threatened a €34 no-show fine. Non-attendance was 5% in both arms.[8] A threat isn't a price paid up front, and it didn't change who was booked.
Five kinds of friction, ranked by how much they filter
Hormozi lists several ways to add friction when lead volume is high and quality is low: stated qualifications, harder form questions, more steps, forced consumption (his favorite, such as a long video before the call to action) and longer ads. Here is how we rank the ones that matter on coaching, course and event funnels.
| Friction | What it filters | What it costs |
|---|---|---|
| A price | Who signs up at all. The strongest screen. | The most volume. |
| Card on file | Casual starters | Fewer starts. Card-required SaaS trials convert 30% to paid, more than 5x no-card trials, but the edge disappears once sign-up rates are counted.[9] |
| Forced consumption | People who won't watch the case for the offer | Bookings. A video before the calendar gives fewer calls, but better ones. |
| 2–4 factual questions | Poor fits before a sales call | Little, if they're short. Our target is no more than 10% drop-off; there's no credible industry benchmark. |
| More steps and fields | Almost nobody | Volume, with no attendance gain.[2] |
Our ranking from running these funnels, not a measured study. Cited figures are from the sources listed.
The bottom row deserves its own paragraph. Jason Fladlien, who teaches webinar selling, argues that registration which is too easy hurts show rate. For price, the data agrees. For steps, it doesn't. PheedLoop found free registrations completed at about 96% and paid at about 86%. Within paid events, no-show stayed flat at about 16% to 19% whatever the completion rate. Its advice is not to add registration friction as an attendance strategy.[2] Price filters. Form friction mostly just loses people.
GetResponse data points the same way. Pages with one to three form fields converted at 11.26%, 12.73% and 13.18%. Pages with four or more converted at 3.88%.[10] That's a correlation across customer pages, not a test, but the cliff sits at the fourth field.
Some friction filters nothing and should simply go. Among US shoppers who abandoned a checkout for a reason other than browsing, 40% cited extra costs and 18% cited forced account creation.[11] Those are buyers you've already won and then lost.
Where to put it: before or after the yes
Where the friction sits matters as much as how much there is.
After the yes: the bump. Keep webinar registration free and offer a low-priced VIP or replay upgrade on the page right after sign-up. It adds nothing to the registration form, because the person has already said yes. In our experience 5% to 12% of registrants take it, and on the funnels we run the bump recovers roughly 40% to 50% of webinar ad spend. No public figure exists for bumps after a free registration; vendor bump rates are measured on paid checkouts, a different denominator.
Before the payoff: the quiz. For a quiz or diagnostic, charge before the result, not after it. Around $20 is low enough to be an impulse buy, and the person is most curious just before the answer. Once they have the result, the reason to pay is gone.
Right after the form: the calendar. For sales calls, put the questions first and the calendar immediately after. Chili Piper reports 66.7% of qualified submissions book when scheduling is offered right after the form.[7] That's B2B demo data from a vendor that sells form scheduling, so read it as direction.
Card for warm, light for cold. A bought-in masterclass audience from your own list can be asked for a card. Cold traffic shouldn't be, even if that means a higher cost per lead. Split-test it rather than assume.
We might get fewer booked calls from here, but they'll be less confused when they show up.
The decision table
This is the default we start from. The test column is the first change we'd try, not a rule.
| Offer | Traffic | Default friction | First test |
|---|---|---|---|
| Free webinar | Cold Meta | Name, email, phone with SMS consent | Add one qualifying question |
| Free in-person event | Cold Meta | Free ticket and Wallet pass, no application | A paid VIP tier alongside free, run at break-even: VIP revenue covers 100% or more of VIP ad spend |
| Masterclass or challenge | Warm list | Card on file or a low price | Remove the card for a cold segment |
| Quiz or diagnostic | Cold | About $20 before the result | Free result plus a paid upsell |
| Booked call ($1K–$50K) | Mixed | 2–4 factual questions, then the calendar | A video before the calendar |
Victory figures are our experience and targets, not a dataset. Rows without a cited figure are our rule of thumb.
Warm audiences tolerate more friction because they already show up. In our experience, a free live webinar to a house list shows 40% to 50% of registrants, in line with Livestorm's 47.7% average show-up in 2025.[12] A cold-traffic evening webinar shows 25% to 35%. The colder the traffic, the less friction it will carry.
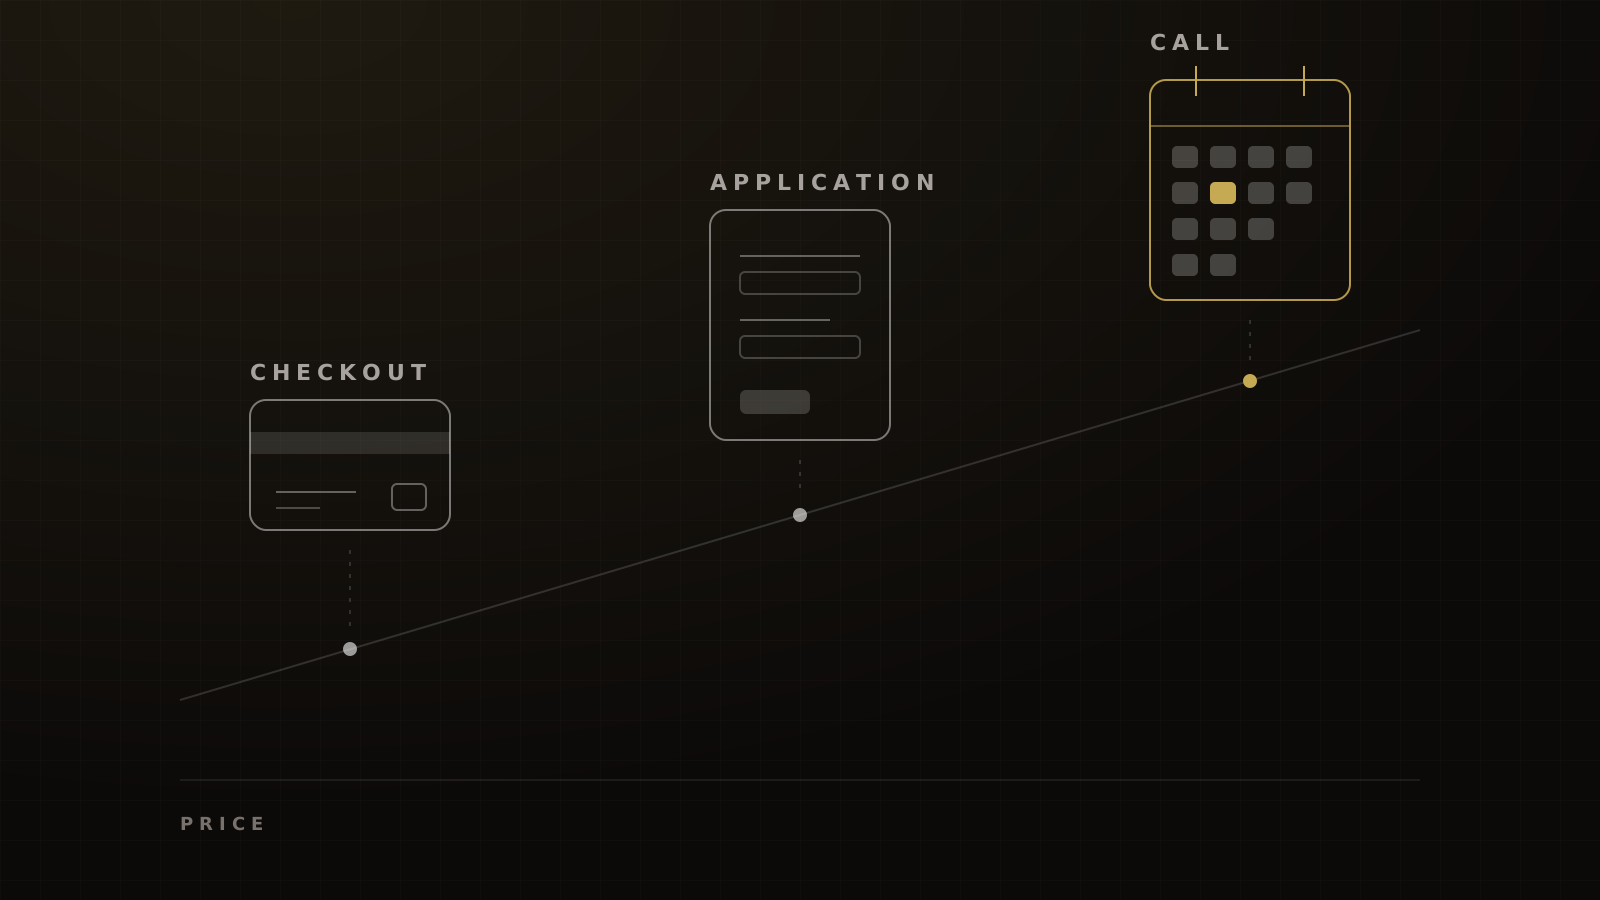
For booked calls, timing beats questions. On calls booked no more than about three days out, we hold an 82% to 88% show rate. If you need to see where calls should go instead of a checkout, read checkout vs application vs call.
Don't put an application on a free event. It costs registrations and, per the data above, doesn't buy attendance.
How to test it without fooling yourself
Opt-in rate is the wrong scoreboard. Friction lowers it by design. The question is whether the people who get through produce more buyers.
Two SaaS sources show why. ChartMogul found the card-required advantage wiped out once sign-up rates are counted.[9] First Page Sage's benchmarks for organic traffic run the other way: 8.5% of visitors start a no-card trial and 18.2% of those pay, against 2.5% and 48.8% with a card.[13] Per 1,000 visitors, that's about 15 paying accounts without a card and about 12 with one. Same question, opposite answers. You have to measure your own funnel per visitor.
A worked example (illustration, not a client result)
Take 1,000 cold visitors to a course offer. The figures below are ranges from our experience plus one public proxy, put together to show the method.
- Free opt-in. Cold Meta traffic to a lead-magnet page converts 15% to 22% on the funnels we run. Call it 200 leads. Kajabi reports that 4.0% of free-start customer relationships ever buy anything.[14] That's about 8 buyers.
- Small paywall. A $7 to $47 sales page on cold traffic converts 3% to 6% in our experience. That's 30 to 60 buyers, and every one has already paid.
The paywall wins here only because the free leads get average follow-up. With strong nurture and a sales team, free can win. Run it on your own numbers with the funnel conversion calculator.
Change one friction point at a time. Our guide to A/B testing low-traffic funnels covers how long to run it and when to call it.
Common mistakes
- Reading a lower opt-in rate as failure. If buyers per 1,000 visitors went up, the friction worked.
- Adding form fields to "raise quality." Fields cost volume and don't raise attendance.[2]
- Putting cold and warm traffic through the same gate. A card a house list accepts will choke a cold audience.
For the full set of stage benchmarks and how friction fits into them, start with our funnel CRO guide. For what the right registration rate looks like on each page type, see landing page conversion rate benchmarks. If you want us to look at where your own friction sits, book a strategy call.
Frequently asked questions
Sources
- 1.Event Data Lab #05: no-show rates by ticket type and event size. PheedLoop, 2026-04-29.
- 2.Event Data Lab #06: registration completion and paying vs non-paying guests (with addendum). PheedLoop, 2026-05-26, addendum 2026-09-01.
- 3.Zero as a special price: the true value of free products. Shampanier, Mazar & Ariely, Marketing Science 26(6), 2007-11.
- 4.Free distribution or cost-sharing? Evidence from a randomized malaria prevention experiment. Cohen & Dupas, Quarterly Journal of Economics (NBER WP 14406), 2010-02 (working paper 2008).
- 5.Can higher prices stimulate product use? Evidence from a field experiment in Zambia. Ashraf, Berry & Shapiro, American Economic Review, 2010-12.
- 6.Lead generation testing: form field length reduces cost per lead by 10.66%. MarketingExperiments (MECLABS), 2011-06-27.
- 7.2025 Benchmark Report on Demo Form Conversion Rates. Chili Piper, 2025-02-18, updated 2025-09-26.
- 8.Effect of a fine on non-attendance at outpatient appointments: a randomised controlled trial. BMJ Open, 2018-04.
- 9.SaaS Conversion Report. ChartMogul, ProductLed and Kyle Poyar, 2026-02-04.
- 10.Email marketing benchmarks. GetResponse, 2024.
- 11.Cart abandonment rate statistics. Baymard Institute, 2025-09-22.
- 12.Webinar Benchmark Report 2026. Livestorm, 2026.
- 13.SaaS free trial conversion rate benchmarks. First Page Sage, 2025-09-05.
- 14.Why most online courses never sell. Kajabi, 2026-08-05.
- 15.Click to cancel just got cancelled: Eighth Circuit vacates entirety of FTC's Negative Option Rule. Cooley LLP, 2025-07-11.
- 16.Negative Option Rule: advance notice of proposed rulemaking. Federal Trade Commission (Federal Register), 2026-03-13.
- 17.Attorney General Bonta issues consumer alert on California's Automatic Renewal Law. California Attorney General, 2025-09-04.
Written by
Ray GillespieCo-Founder & COO
Ray runs day-to-day operations across every Victory engagement, building the systems, automations and AI-powered workflows that hold the machine together. He has overseen operations behind more than $120M in revenue.
Part of the guide: Funnel CRO: Benchmarks, Diagnostics and Tests for Coaching, Course and Event Funnels