What Is a Good Landing Page Conversion Rate? 2026 Benchmarks by Traffic Source and Offer
Unbounce's 6.6% is a median, not an average. 2026 landing page benchmarks by industry, traffic source and offer, plus the ranges we see on our funnels.
 Ray GillespieCo-Founder & COO
Published 8 min read
On this page
Key takeaways
- Unbounce's 6.6% is a median of 41,000+ landing pages, not an average, and it excludes pages that never converted.[1]
- For education pages the median is 8.4%. The top quarter convert at 20% or more.[2][3]
- Traffic source matters more than industry. Education pages convert 14.1% from email and 5.1% from paid social.[2]
- Ads Manager "conversion rate", site-wide conversion and purchase rate are different fractions. Don't compare them with a page rate.
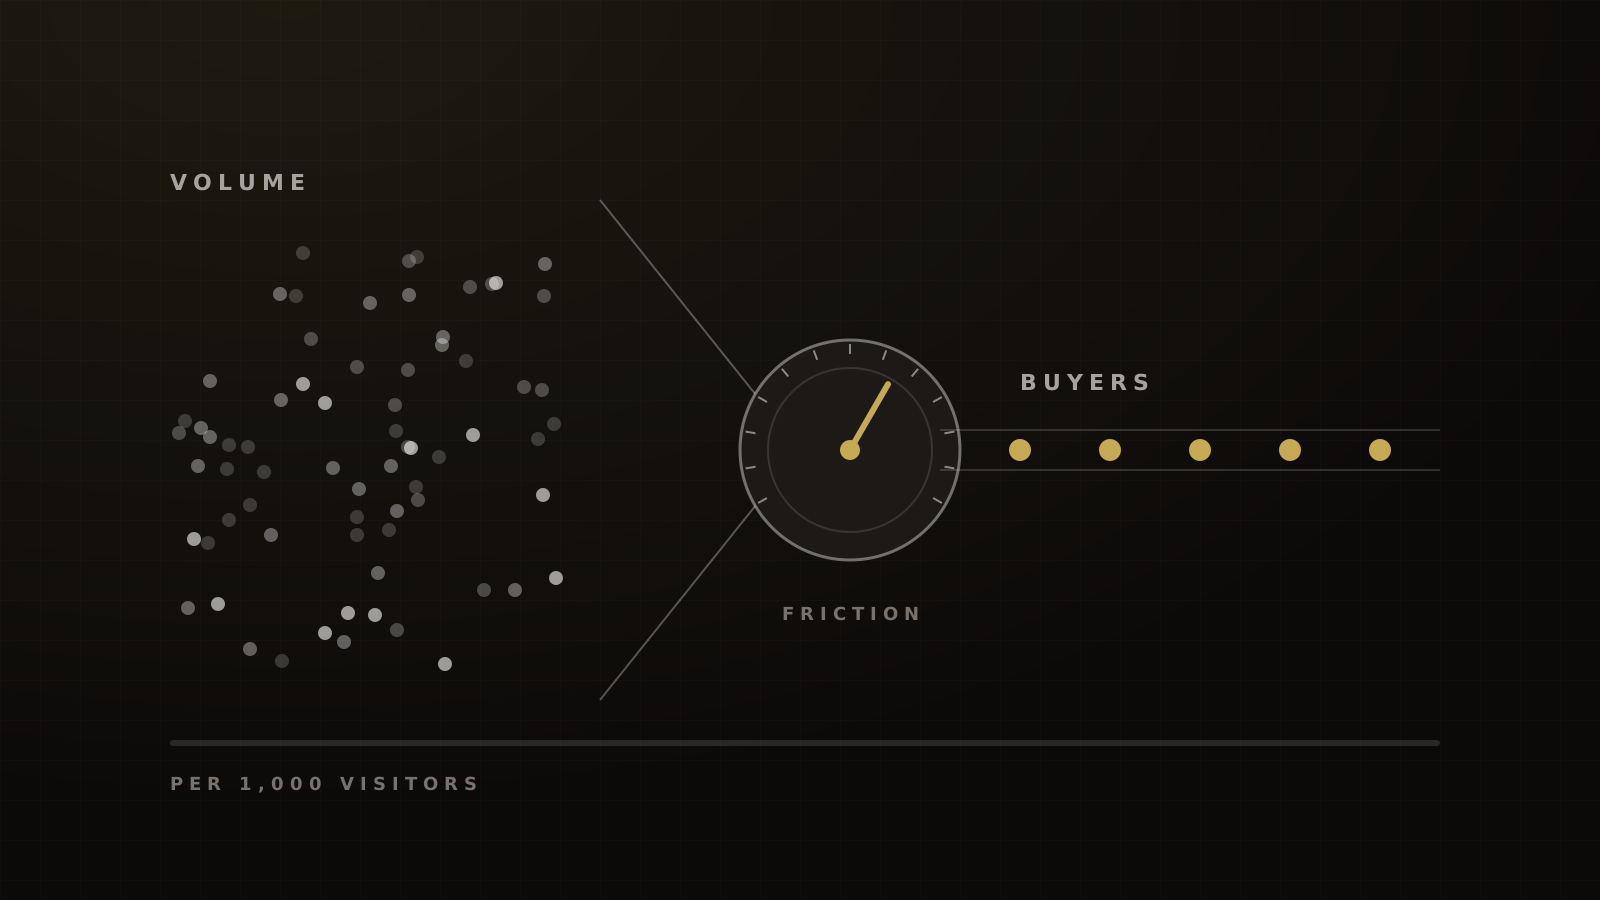
- A high opt-in rate is not the goal. Buyers per 1,000 visitors is.
A good landing page conversion rate depends on who's arriving. The most quoted benchmark, Unbounce's 6.6%, is the median page across all industries. For education pages it's 8.4%, and the top quarter of education pages clear 20%.[2][3]
But traffic source moves the number more than industry does. Education pages convert at 14.1% from email and 5.1% from paid social.[2] So a cold Meta opt-in page at 12% is doing well. An email-list page at 12% is underperforming.
Here's how to read the benchmarks without fooling yourself, what they say by industry, traffic source and offer, and the ranges we see on coaching, course and event funnels.
How to read a conversion benchmark without fooling yourself
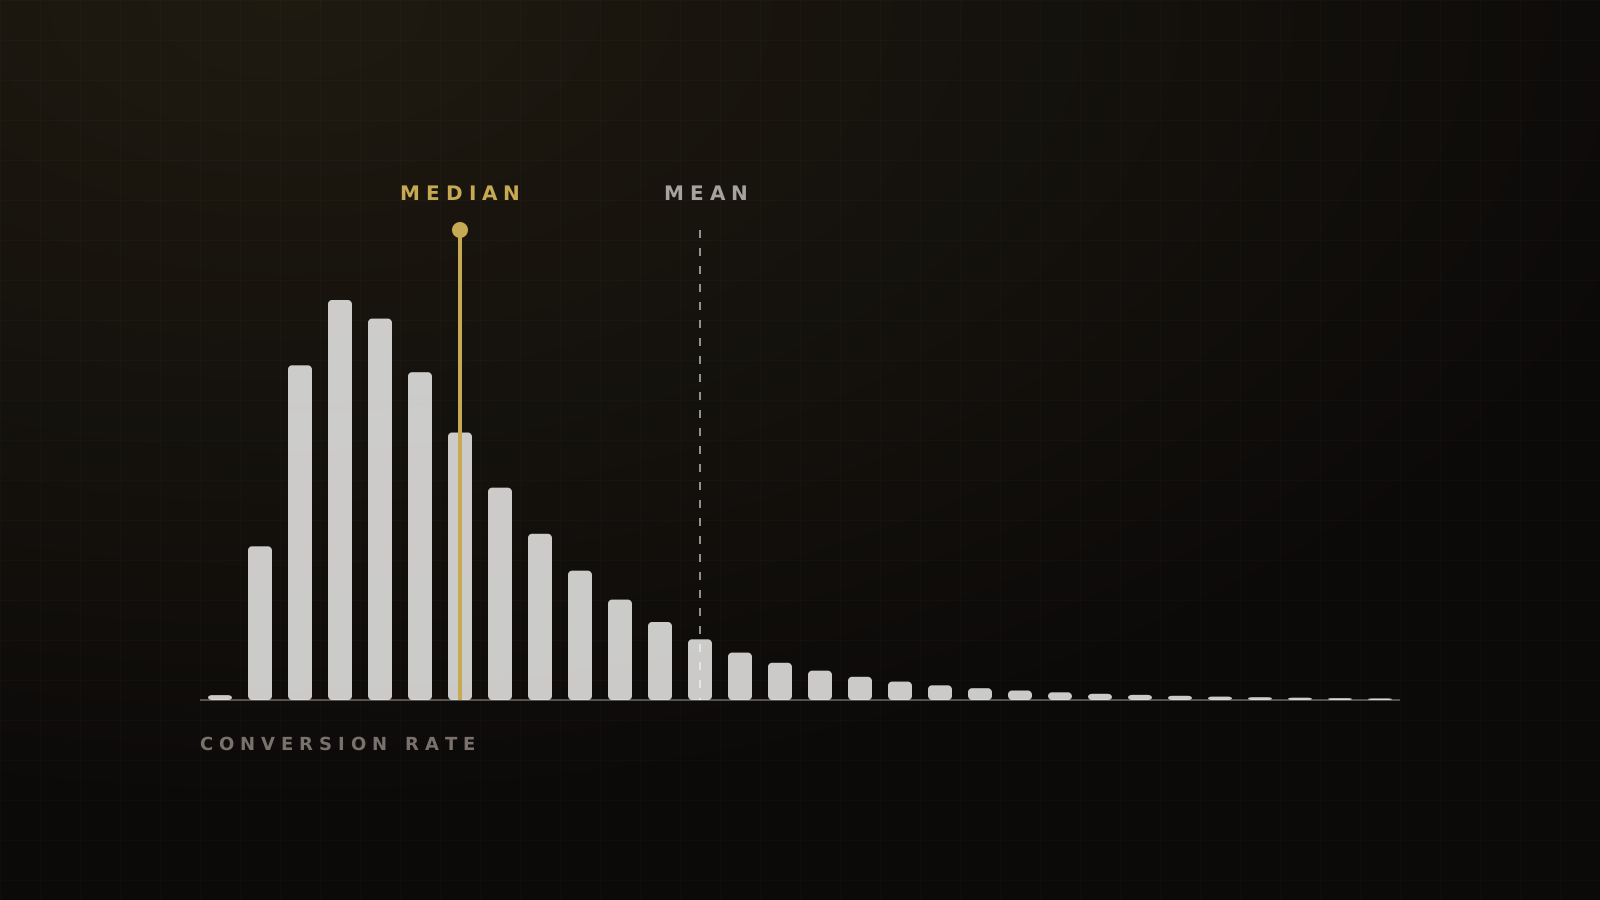
Median vs mean
Unbounce's 2024 report studied more than 41,000 landing pages and 464 million visitors from July 2023 to July 2024. Its headline is that the median conversion rate across all industries is 6.6%.[1]
Median landing page conversion rate, all industries, 41,000+ pages, July 2023 to July 2024
Most articles call that an average. It isn't, and the difference is large in this kind of data. In Unbounce's 2020 report, the same pages produced a 3.2% median and a 9.7% mean.[4] A small number of very high-converting pages drag the mean up. If your page converts at 5%, you're below the 2024 median but far closer to typical than a mean would suggest.
Who's excluded, and what counts
Unbounce leaves out pages with fewer than 50 visitors and pages with zero conversions. It also drops industries with fewer than 400 pages.[5] Dropping every page that never converted pushes the median up.
A "conversion" there is whatever the page owner set: a form submit, a click, or both.[1] A page whose goal is a click to the next step will convert higher than one whose goal is a nine-field form.
Four numbers people confuse
| Number | What it divides | Example |
|---|---|---|
| Landing page conversion | Conversions ÷ unique page visitors | Education median 8.4%[2] |
| Ad-platform conversion | Leads ÷ clicks, in Ads Manager | Meta lead campaigns, Education, 15.87% in 2026[6] |
| Site-wide conversion | Forms and calls ÷ all sessions | Education 6.3%[7] |
| Purchase rate | Sessions with a purchase ÷ sessions | Shopify store median 1.4%[8] |
All four are correctly sourced. They can't be compared with each other.
The Meta figure is the one that misleads most. LocaliQ puts Education and Instruction lead campaigns at 15.87% conversion and $26.31 per lead in 2026.[6] That's leads per click as Meta reports them, which can include instant forms. The 2025 edition, built on 726 campaigns, had the same category at 10.08% and $28.22.[9] A swing that size from one year to the next is a sign of a small, volatile sample. Use it as a rough guide for ad accounts, never as a page benchmark.
2026 benchmarks by industry
Unbounce's industry medians range from 3.8% to 12.3%.[1] Its follow-up analysis adds the 75th percentile, the line you need to clear to be in the top quarter.[3]
| Industry | Median | Top quarter starts at |
|---|---|---|
| Education | 8.4%[2] | 20%[3] |
| Professional services | 6.1%[10] | 14.1%[3] |
| Ecommerce | 4.2%[3] | 11.4%[3] |
| Entertainment | 12.3%[3] | 40.8%[3] |
| Wellness (health subcategory) | 8.2%[11] | not published |
Unbounce-hosted pages, July 2023 to July 2024. Medians, not averages.
Inside education, the subcategories spread widely. Online course pages have an 18.3% median, general course pages 13%, higher education 6.3% and tutoring 4.9%.[2] Unbounce explains the online-course figure by how many of those pages offer something free or low-ticket. That's closer to a lead magnet than a sales page.
For coaching, professional services is the nearest proxy. Its median is 6.1%.[10]
Benchmarks by traffic source
Across all industries, email-referred visitors convert highest, at 19.3% on average. Paid social converts at 12% and paid search at 10.9%. Instagram (17.9%) and Facebook (13%) are the highest-converting paid social platforms.[1]
Note the change of measure: those channel figures are averages, while the 6.6% headline is a median.[1]
The education split is the one that matters for our readers:
Unbounce, 2024 data. Unbounce also reports education ranges of about 6% for Facebook and 10.7% for Instagram, worded loosely enough that we treat them as rough.
Cold social traffic converts at roughly a third of the email rate. Professional services shows the same pattern: 13.9% from email and 4.4% from paid social.[10]
Device matters too. 83% of landing page visits in Unbounce's data were on mobile, while desktop converted 8% better.[1] For education pages the desktop edge was 17.6%.[2] Paid social traffic is mostly phones, so a page that only works on desktop loses twice.
Reading level shows a strong link too. Pages written at a 5th to 7th grade level converted at 11.1%, against 5.3% for professional-level copy.[1] That's a correlation, not a controlled test.
Benchmarks by offer type
Offer type changes what a "conversion" is. A free webinar registration and a $47 checkout aren't the same ask.
| Offer | Public figure | Denominator and caveat |
|---|---|---|
| Lead magnet or opt-in page | 10.76% average, all industries; education 9.53%[12] | GetResponse pages, 2023 data, average |
| Webinar registration page | 22.3%[12] | GetResponse pages promoting a webinar, 2023 data |
| Webinar registration page | 17%, vs 11% for all pages[13] | Leadpages users; no method published |
| Event registration page | 21.5%[14] | Bizzabo, registrations ÷ page visits, mostly B2B events, 2025 |
| Quiz funnel | 40.1% of quiz starters become leads[15] | Starters, not visitors |
| Low-ticket product under $50 | 3–5% buy (estimate)[16] | ClickFunnels estimate, no sample |
| Course sales page | 1–3% buy (estimate)[16] | ClickFunnels estimate, no sample |
Vendor data from each platform's own customers. Several sources publish no sample or method; we say so where that's the case.
Three details in that table save people money.
Form length has a cliff, not a slope. In GetResponse's data, pages with 1, 2 and 3 fields converted at 11.26%, 12.73% and 13.18%. Pages with 4 or more fields dropped to 3.88%.[12] It's correlation, but it matches what we see: the third field costs little, the fourth costs a lot.
Two-step opt-ins aren't magic. Across 10 Leadpages split tests, two-step forms averaged 44% and one-step forms 45%, with one-step winning 6 of the 10.[17] Test it, don't assume it.
Flow design moves event registration. In Bizzabo's data, dynamic registration flows converted 24.4% against 11.6% for static ones.[14]
What we see in coaching, course and event funnels
No public source splits coaching, course and event pages by cold vs warm traffic. Here are the ranges we work to. They're operator ranges from our experience, not a dataset.
| Page and traffic | Nearest public figure | What we typically see |
|---|---|---|
| Generic opt-in or lead magnet, cold Meta | Facebook-referred, all industries, 13%[1] | 15–22% |
| Webinar or event registration, cold Meta | GetResponse webinar pages 22.3%[12] | 22–30% |
| Registration page, warm email or SMS | Email-referred 19.3%;[1] education email 14.1%[2] | 25–35% |
| Low-ticket ($7–$47) sales page, cold | ClickFunnels estimate 3–5%[16] | 3–6% buy |
Victory ranges are our experience on coaching, course and event funnels, not a published study.
Our ranges sit above the all-industry medians for a reason. A free, dated invitation to one audience, matched to one ad, should beat a median built from every kind of page.
When a client tells us the ads aren't working, the opt-in rate is the first thing we check. Usually the ads are delivering clicks and the page is losing them.
Cost per lead tells the same story from the other side. LocaliQ puts the all-industry Meta lead-campaign CPL at $27.39 in 2026.[6] For a curiosity-led event opt-in, our target is $15 to $25. On webinars, our best CPL for years was $8 to $10. Our current best is $4 to $5, on a weekly evening webinar where ads run only in the 2 days before each session. That's one program under those conditions, not a promise, but it shows how much a tuned page plus a short ad window moves the cost.
Why a "good" opt-in rate can still lose money
The page's job isn't opt-ins. It's buyers.
Strip a form to one field, remove every qualifier and promise more, and the opt-in rate climbs. Whether buyers climb with it is a separate question, and most dashboards never ask it. Kajabi found that only 4.0% of 36.2 million customer relationships that started with something free ever bought anything.[18] Volume at the top doesn't guarantee revenue at the bottom.
Alex Hormozi's point is that friction lowers volume and raises quality, and that you tune it to what you need. We agree, with one rule of thumb: on a free event registration form, adding 2 or 3 soft qualifying questions should cost no more than about 10% of registrations. That's the line we hold. No credible industry benchmark exists for it.
The measure we use is revenue per visitor: buyers per 1,000 visitors times average order value. Hormozi's value grid makes the same argument from the offer side: what the back end earns tells you what a lead is worth. To see how one stage feeds the next, run your numbers through our funnel conversion calculator. For the full stage-by-stage view, see our funnel CRO guide.
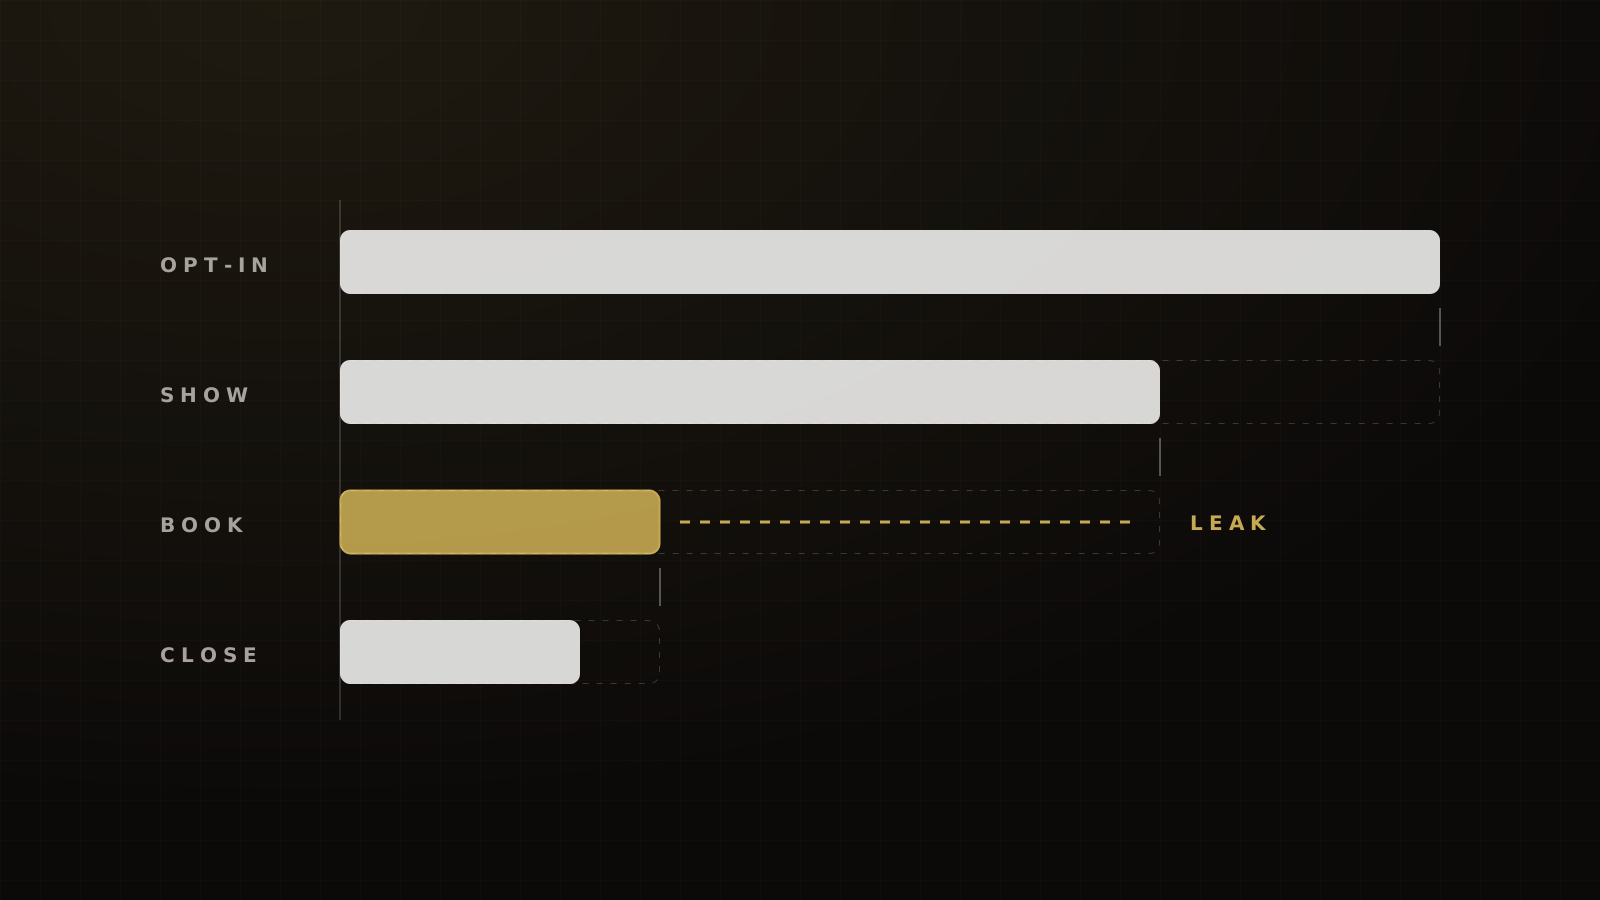
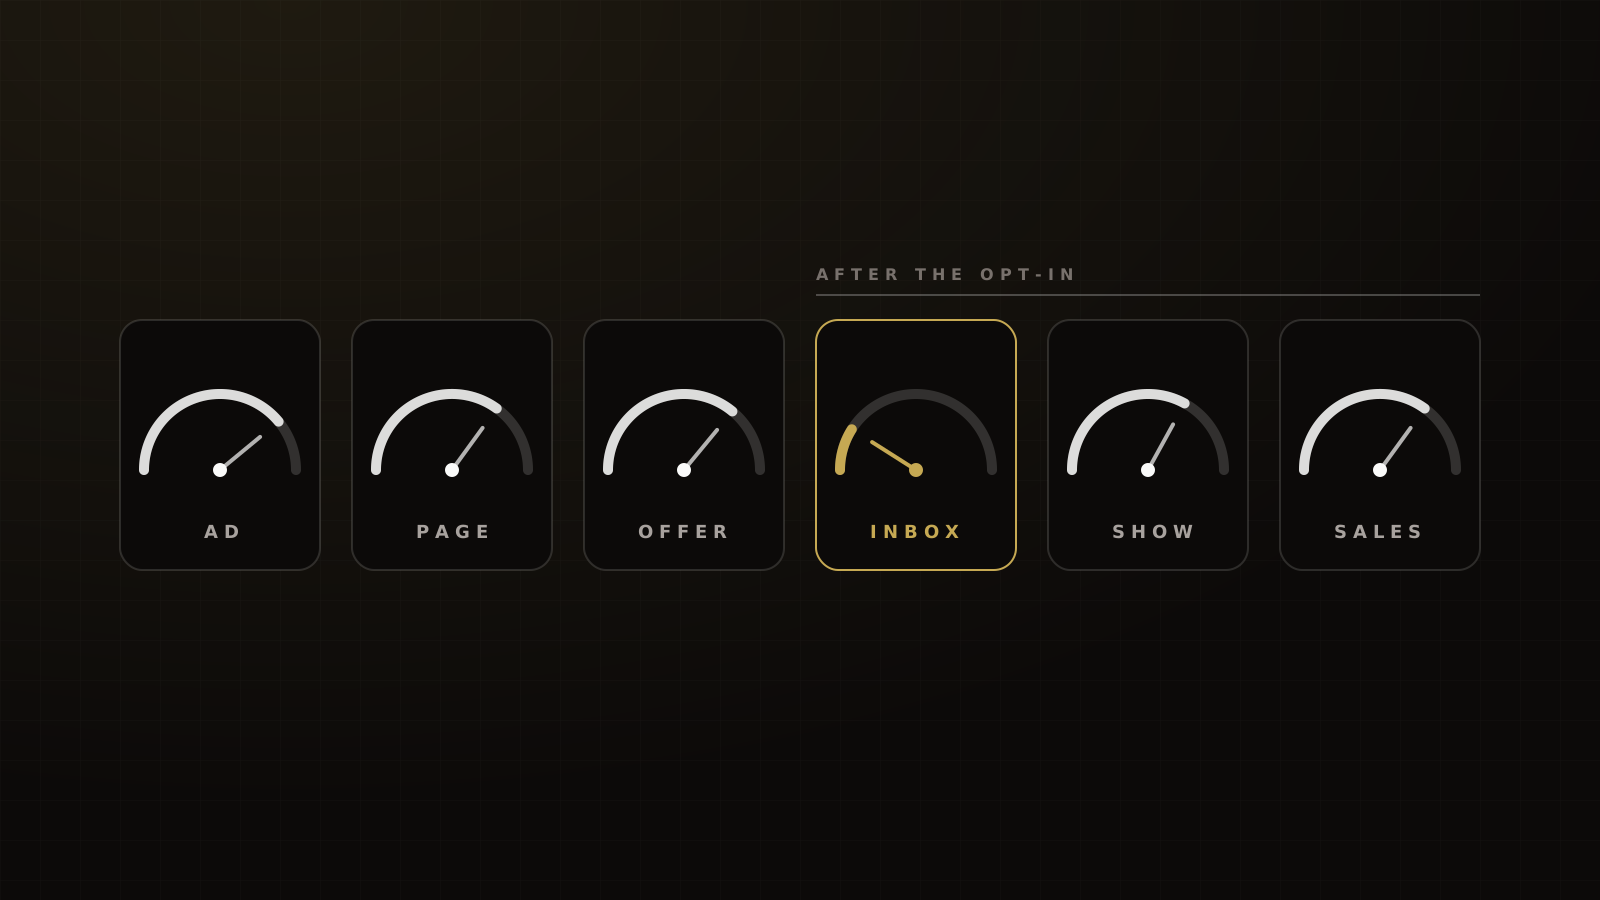
If your page converts but nobody shows up or buys, the leak is further down. Our funnel diagnostic walks through each stage in order. For event funnels specifically, our event marketing and show rates guide covers what happens after the registration page.
To check whether a page change actually won, read our guide to A/B testing low-traffic funnels before you call the result.
Myths to stop repeating
- "The average landing page converts at 2.35%, and the top 10% at 11.45%." That's WordStream's 2014 distribution of Google Ads account conversion rates, not landing pages.[19] It's more than 12 years old.
- "The average landing page converts at 5.89%." HubSpot's post gives the figure without a page sample. The data it describes is a July 2023 survey of 101 marketers.[20]
- "The average landing page converts at 9.7%." That's the mean from Unbounce's 2020 report, on 2019 data. The median in the same data was 3.2%.[4]
- "11.4% is a good conversion rate." That's Unbounce's top-quarter threshold for ecommerce only. For education it's 20%; for entertainment, 40.8%.[3]
Frequently asked questions
Sources
- 1.2024 Conversion Benchmark Report. Unbounce, 2024-08-29 (modified 2024-09-04).
- 2.Education landing page conversion rates. Unbounce, 2024-11-05.
- 3.What's a good conversion rate?. Unbounce, 2025-07-25 (updated 2025-12-09).
- 4.Conversion Benchmark Report 2020. Unbounce, 2020-04-17.
- 5.Conversion Benchmark Report: methodology. Unbounce, 2024.
- 6.Facebook advertising benchmarks. LocaliQ / WordStream, 2026-09-23.
- 7.Conversion rate benchmarks by industry 2026. Ruler Analytics, 2026-05-26.
- 8.Ecommerce conversion rate benchmark. Littledata, 2026-10 (live benchmark page).
- 9.Facebook ads benchmarks 2025. WordStream, 2025-09-15.
- 10.Professional services landing page conversion rates. Unbounce, 2024.
- 11.Healthcare and wellness landing page conversion rates. Unbounce, 2024.
- 12.Email marketing benchmarks. GetResponse, 2024.
- 13.Webinar landing page examples. Leadpages, 2023-08-24 (updated 2026-02-03).
- 14.Event program benchmarks 2026. Bizzabo, 2026-03-05.
- 15.Quiz conversion rate report 2026. Interact, 2026-09-08.
- 16.Traffic but no sales. ClickFunnels, 2026-09-17.
- 17.2-step opt-in forms. Leadpages, 2020-07-28.
- 18.Why most online courses never sell. Kajabi, 2026-08-05.
- 19.What is a good conversion rate?. WordStream, 2014-03-17.
- 20.Landing page statistics. HubSpot, 2024-10-07.
Written by
Ray GillespieCo-Founder & COO
Ray runs day-to-day operations across every Victory engagement, building the systems, automations and AI-powered workflows that hold the machine together. He has overseen operations behind more than $120M in revenue.
Part of the guide: Funnel CRO: Benchmarks, Diagnostics and Tests for Coaching, Course and Event Funnels