Why Your Landing Page Gets Traffic but No Conversions: A Funnel Diagnostic by Stage
Traffic but no conversions means a leak. Check ad, page, offer, inbox, show rate and sales follow-up in order, each against a number, before adding spend.
 Ray GillespieCo-Founder & COO
Published 10 min read
On this page
- Before you diagnose: make sure the numbers are real
- Stage 1: is the ad the problem? (Hook)
- Stage 2: is the page the problem? (Story)
- Stage 3: is the offer the problem? (Offer)
- Stage 4: did the follow-up arrive?
- Stage 5: did they show up?
- Stage 6: did sales follow up fast enough?
- The one-afternoon checklist
Key takeaways
- If a page gets traffic but no conversions, the ads are rarely the first thing to fix. Check the funnel in order, and tie each check to a number.
- Ad, page, offer: Russell Brunson's Hook, Story, Offer tells you which of the three failed.
- For education pages, about 5% conversion from paid social and 14% from email are the medians to beat.[1]
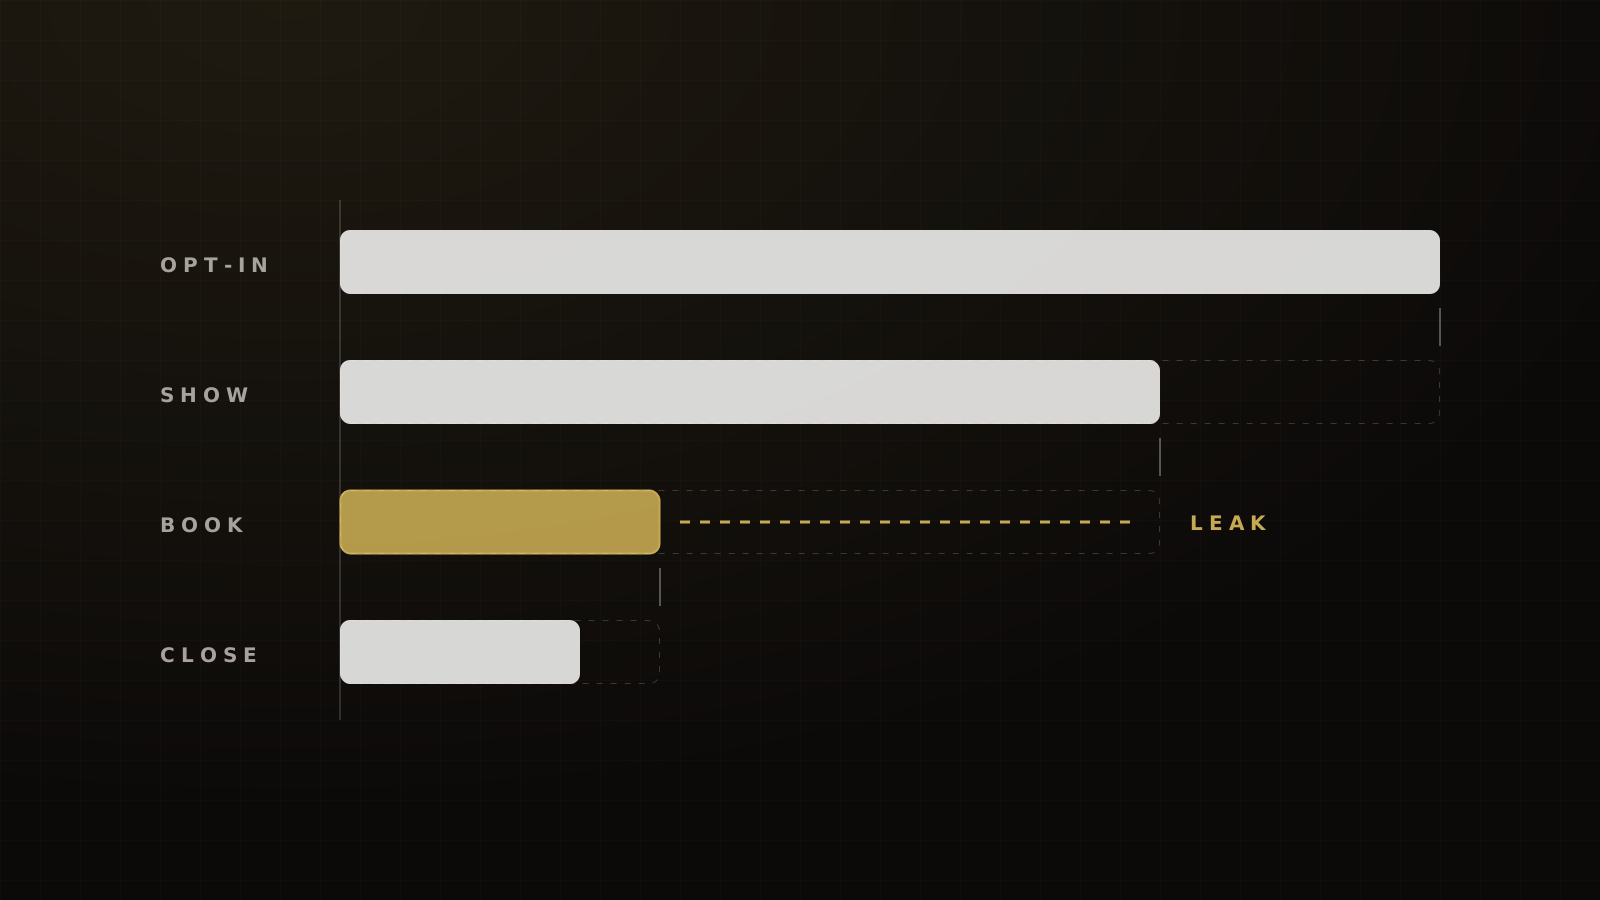
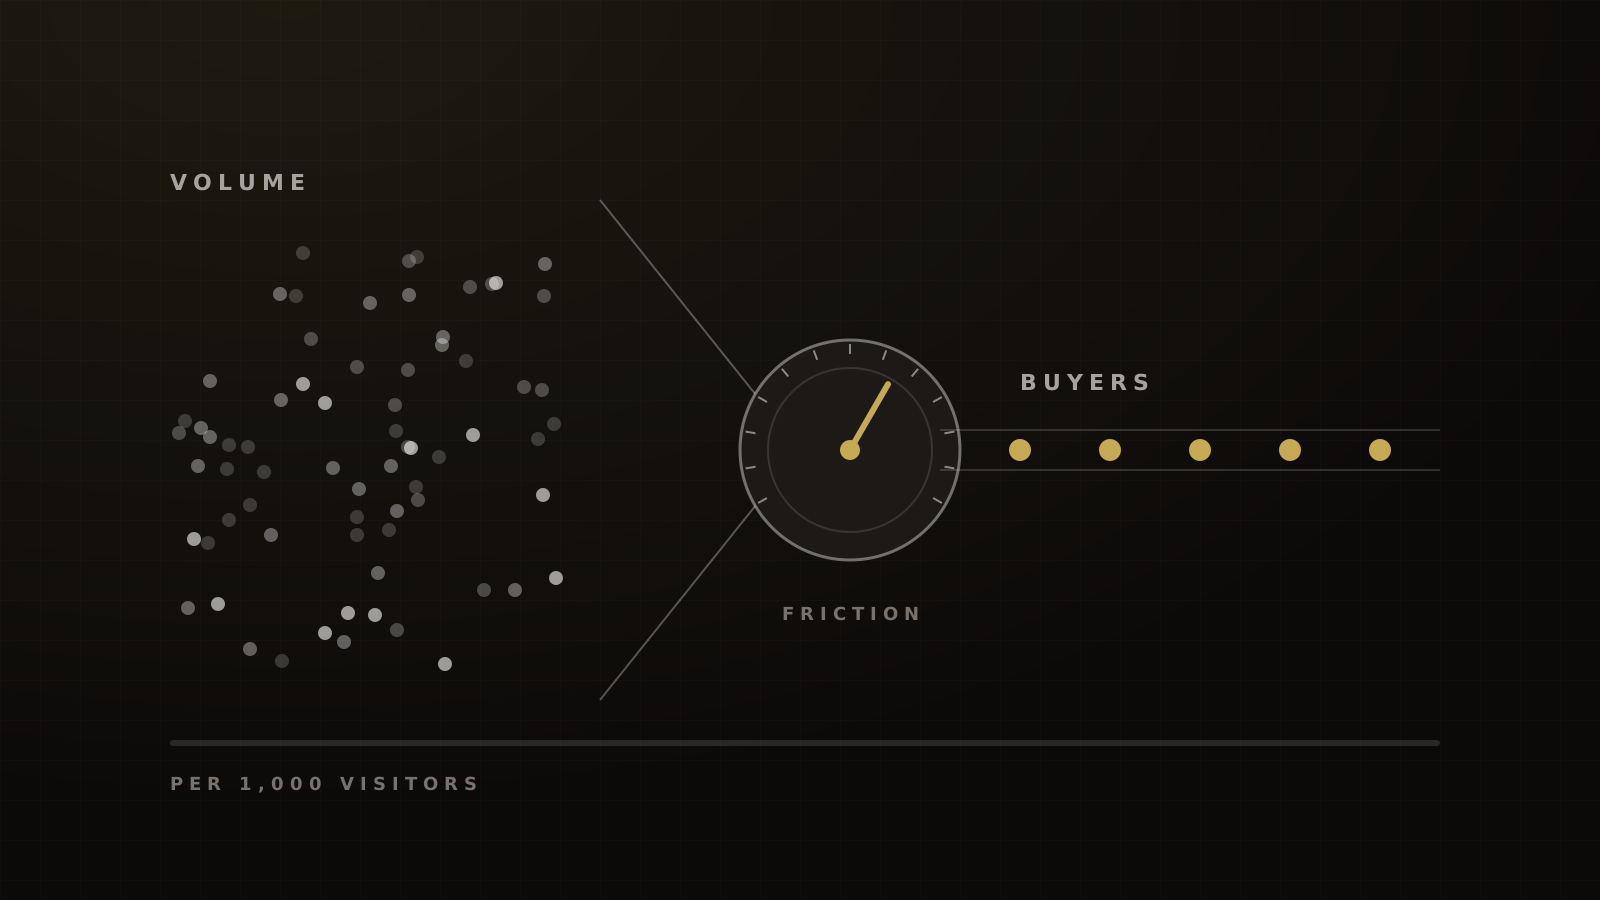
- For coaching and event funnels, "no conversions" often means "no buyers", and the leak sits after the page: inbox, show rate or sales follow-up.
- Touch ad spend last.
If your landing page gets traffic but no conversions, don't start with the ads. Work down the funnel in order, and give each check a number that tells you whether it's the culprit.
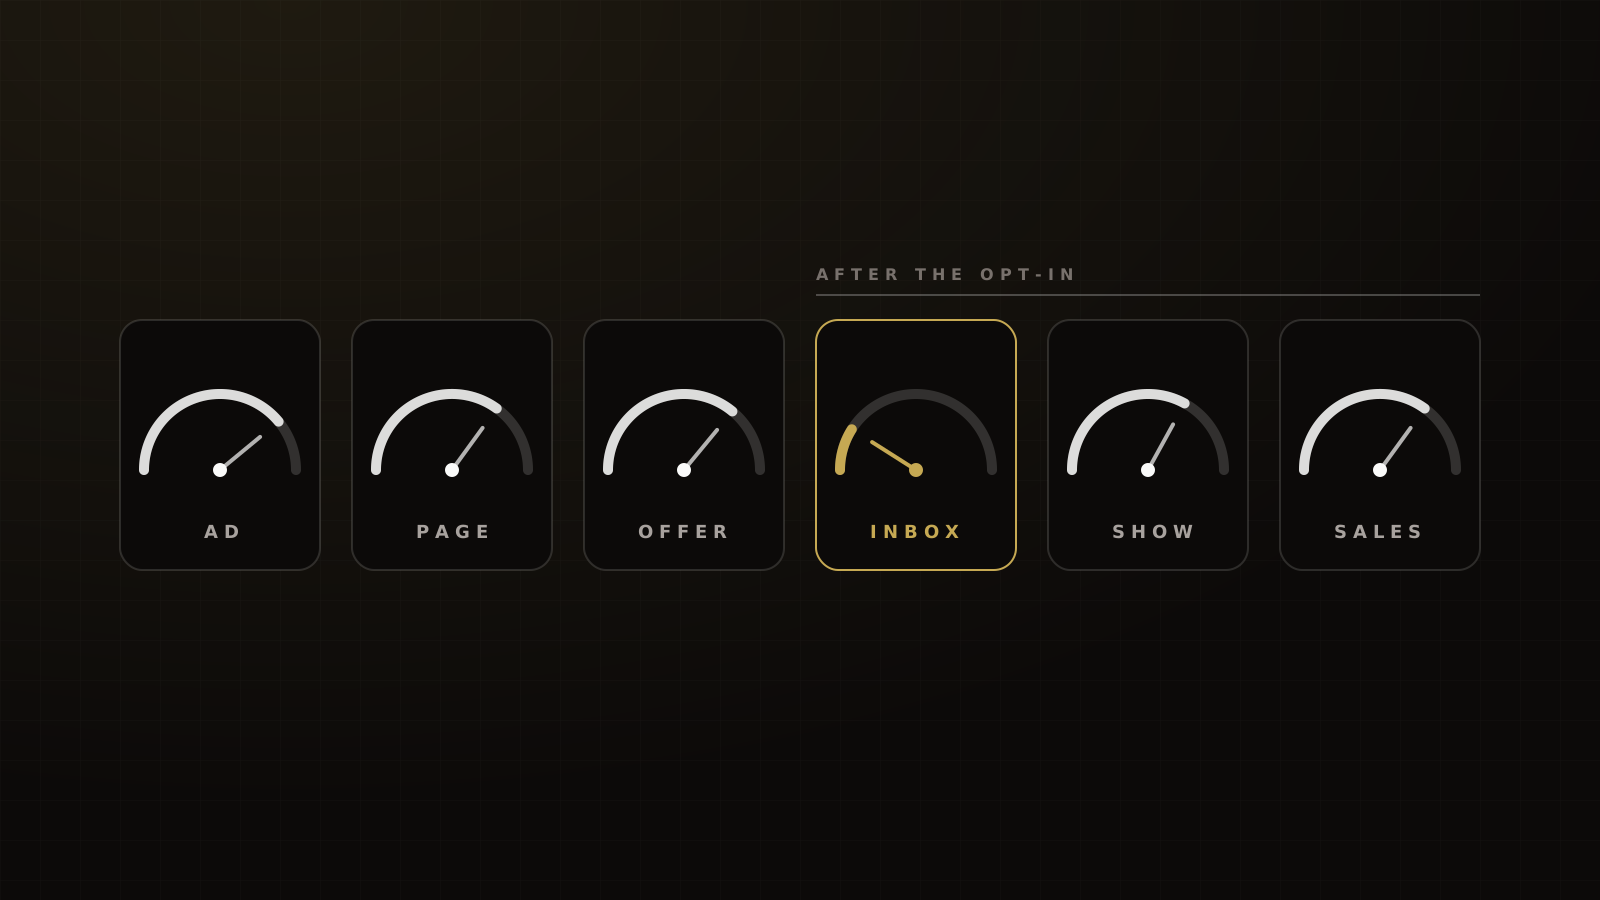
Check the ad, then the page, then the offer. Then check what happens after the opt-in: whether the emails reach the inbox, what the confirmation page says, whether people show up and how fast sales follows up. Only after all of that should you touch ad spend.
Most diagnostics stop at the page. This one keeps going through the measured chain after the opt-in, which is where coaching and event funnels often leak.
The ads can be as great as possible, but if the rest of the system is flawed, the outcome will be flawed.
Before you diagnose: make sure the numbers are real
A tracking error looks exactly like a conversion problem. Rule it out first.
Meta merges a browser Pixel event and a server event only when both carry the same event ID and event name within 48 hours. If they don't match, it counts both.[2] Double-counted leads make a weak page look healthy. Missing events make a healthy page look dead.
Embedded calendars and order forms are the other trap. Microsoft Clarity can't render third-party iframes, and only captures clicks inside first-party ones.[3] If your booking widget sits in a third-party iframe, the recordings won't show what people did in it.
Go through the funnel yourself, from the ad to the confirmation email. Our funnel CRO guide covers the full tracking gate.
Stage 1: is the ad the problem? (Hook)
Brunson's Hook, Story, Offer says every ad, page and pitch has three parts, and when one underperforms, one of the three is broken. The hook is the ad's job: stop the right person and get the click.
The number to check is link CTR. LocaliQ's 2026 benchmark for Education and Instruction lead campaigns is 1.74%, against 2.70% for all industries.[4] The 2025 edition put Education lead campaigns at 1.86%.[5] On a working cold webinar or event ad, we typically see 1.8% to 2.5%.
If you're inside that range, the hook is probably fine. Move on.
One caveat: a very direct ad often gets fewer clicks from better-fit people, so for cold event traffic we judge ads on cost per lead and lead quality, not CTR alone. Our paid ads for coaches guide covers how we set those targets.
Meta's free ad-vs-page test
Meta ranks each ad on quality, engagement rate and conversion rate, compared with ads competing for the same audience. Rankings aren't shown below 500 impressions.[6] Read together, they tell you where the problem is:
| Quality | Engagement | Conversion | What it points to |
|---|---|---|---|
| Average or above | Average or above | Below average | The call to action or the page after the click |
| Below average | Average | Below average | Clickbait: the ad over-promises[6] |
From Meta's own interpretation guidance. Diagnostics aren't inputs to the ad auction.
If people like the ad and click it but don't convert, the hook works and the story doesn't.
Message match
The page's headline should repeat the ad's promise in the ad's words. The evidence for this is thinner than most CRO blogs claim. One documented test, a SaaS brand on paid search with 1,274 visitors in 2017 and 2018, found that mirroring the search term in the headline lifted trial sign-ups 31.4%.[7] The widely quoted "212% message-match lift" came from a before-and-after where the account, targeting and landing pages all changed at once.[8]
We still check it first, because it costs nothing to fix.
Stage 2: is the page the problem? (Story)
The story is the page's job: build enough value that the visitor takes the next step.
Compare your page's conversion rate with its traffic source, not with an all-industry average. Education pages convert at 5.1% from paid social and 14.1% from email.[1] Across all industries, Facebook-referred visitors convert at 13%.[9]
On the funnels we run, cold Meta traffic converts 15% to 22% on a generic opt-in page and 22% to 30% on a webinar or event registration page. Warm email or SMS traffic converts 25% to 35%. If your CTR is inside our range and your page is far below these, the page is the leak.
Then find out why. These checks are in the order we run them:
- Engagement. In GA4, an engaged session lasts longer than 10 seconds, has a key event, or has 2 or more page views.[10] Siege Media's data across 546 GA4 properties puts the median engagement rate at 20.2% for paid social, against 50.9% for email.[11] Low engagement from email is the warning sign.
- Mobile. 83% of landing page visits in Unbounce's data were on mobile, while desktop converted 8% better.[9] Open the page on a phone, on cellular data, and try to sign up.
- Speed. In a Google-commissioned Deloitte study, a 0.1-second mobile speed improvement was associated with 21.6% better lead-gen form progression, on 2019 data.[12]
- Reading level. Pages written at a 5th to 7th grade level converted at 11.1%, against 5.3% for professional-level copy.[9] It's a correlation, and a consistent one.
- Form length. In GetResponse's data, pages with 1 to 3 fields converted around 11% to 13%; pages with 4 or more converted at 3.88%.[13]
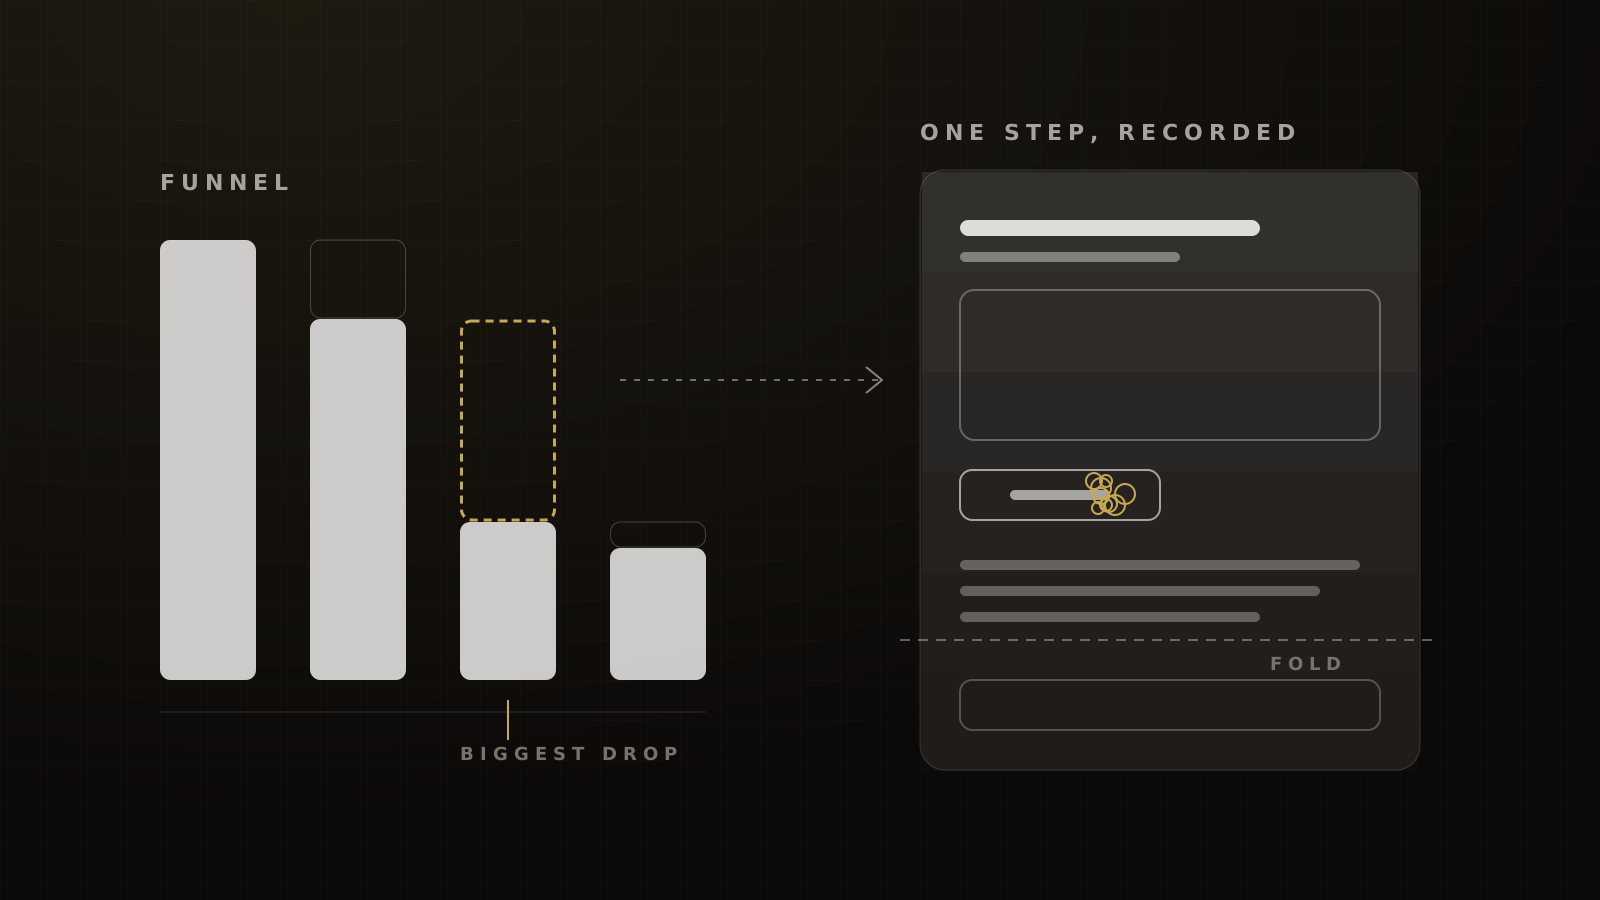
- Friction signals. Clarity flags rage clicks (rapid repeated clicks in one spot), dead clicks (clicks that change nothing) and quick backs (people who leave and come straight back).[14] Our guide to session recordings and heatmaps covers how to read them.
Stage 3: is the offer the problem? (Offer)
If visitors click, scroll and read but still don't act, the offer is the likely leak.
Alex Hormozi's value equation is the cleanest test. Value goes up with the dream outcome and the buyer's belief they'll get it, and down with the time it takes and the effort it costs. Read your page as a stranger and score each one. Most weak offers are vague on the outcome and heavy on effort.
For paid offers, check the checkout. Baymard's research on US online shoppers lists extra costs (40%), forced account creation (18%) and a long or complicated checkout (17%) among the top reasons for abandoning a checkout.[15] That's ecommerce data, and the fixes carry over: show the full price, skip the account, cut the fields.
Sometimes the offer is fine and the shape is wrong: a high-ticket offer pushed to checkout, or a cheap one pushed to a call. See checkout, application or booked call and where the friction should go.
Stage 4: did the follow-up arrive?
This is the stage most diagnostics skip, and one we often find broken in audits. If the confirmation email lands in spam, the registrant never gets the link, the time or the reason to show up.
The sender rules. Since February 2024, Gmail requires bulk senders (5,000 or more messages a day) to authenticate with SPF, DKIM and DMARC, offer one-click unsubscribe, and keep the spam rate reported in Postmaster Tools below 0.10%, never reaching 0.30%.[16] Yahoo sets the same 0.3% line and requires unsubscribes to be honored within 2 days.[17] Outlook.com requires SPF, DKIM and DMARC from domains sending more than 5,000 emails a day, and non-compliant mail is junked or rejected.[18]
Delivered isn't inbox. Your email platform's "delivered" rate means the receiving server accepted the message. Mailgun's retail senders saw 98.74% delivery across 8 billion emails in 2025, and Mailgun itself says delivered doesn't equal inbox.[19]
Inbox placement is the real number. Validity's seed-list data put global inbox placement at 87.2% in 2025: about 1 in 8 emails missed the inbox.[20] For education senders it was 87.6% inbox and 7.9% spam. Microsoft's inboxes were the toughest, at 77.4%, against 89.8% for Gmail.[20]
On domains we manage, our targets are 90% or better inbox placement on pre-send seed tests after remediation, and a Gmail spam rate kept under 0.1%. If you can't measure placement, you can't rule this stage out.
SMS has its own failure mode. A raw link in the first text from an unfamiliar number is the classic carrier-filter trigger. CTIA's guidance says any link shortener should be dedicated to the sender, and links should identify the website owner.[21] After moving reminders to drip sends, a registered number and trigger links on the brand's own domain, our target is 95% or more delivered. The full fix is in our post on SMS carrier filtering and trigger links.
Stage 5: did they show up?
Livestorm's live webinar show-up rate was 47.7% in 2025, across more than 7 million registrations.[22] That's mostly organizations promoting to their own audiences. On cold paid traffic to a single-date evening webinar, we typically see 25% to 35% live. To a warm house list, 40% to 50%. For a free one-day in-person event, 35% to 45% when it's run well.
Below those ranges, check three things:
- The confirmation page. It should give the date, time, location or link, an add-to-calendar button and what to do next. We've seen pages that said only "you're registered", and the turnout reflected it. Our thank-you page guide lists every component.
- The reminder cadence. Email and SMS, timed to the event, with the link in a follow-up rather than the first text.
- The ad window. On our weekly webinar program, ads run only in the 2 days before the event. Running them 2 weeks out raises cost per lead and lowers show rate.
Stage 6: did sales follow up fast enough?
For high-ticket funnels, the last leak is the gap between a raised hand and a conversation.
In a RevenueHero mystery-shop of 1,000 B2B websites, only 365 demo requests got any response, and the average response took 29 hours and 17 minutes.[23] The original speed-to-lead study, from 2007, found the odds of qualifying a lead were 21 times higher when it was called within 5 minutes rather than 30.[24] That's qualification, not sales, and the data is old.
Our standard is a median time to first dial under 1 hour during staffed hours, and every new lead dialed within 24 hours. For booked calls, the B2B median no-show is 13.5%.[25] On the phone calls we run, 82% to 88% are held when booked no more than about 3 days out. Long booking windows leak. More on this in our speed to lead research.
The one-afternoon checklist
| Stage | Metric | Threshold to clear | First fix |
|---|---|---|---|
| Tracking | Meta leads vs CRM contacts | Close match, events deduplicated | Fix event IDs and cross-domain tracking |
| Ad (hook) | Link CTR | 1.74% benchmark;[4] our range 1.8–2.5% | New hook, same offer |
| Page (story) | Opt-in rate by source | Cold Meta 22–30% on registration pages; warm 25–35% | Message match, then mobile and form length |
| Offer | Engaged visitors who don't act | Engagement fine, conversion low | Sharpen the outcome, cut effort |
| Follow-up | Inbox placement; spam rate | 90%+ seed-test inbox; under 0.1% Gmail spam rate | Authentication, list hygiene, content |
| Show | Live show rate | Cold webinar 25–35%; warm 40–50%; in-person 35–45% | Confirmation page and reminders |
| Sales | Time to first dial; calls held | Under 1 hour; 82–88% held | Shorter booking window, staffed follow-up |
Thresholds combine published benchmarks with Victory's operating ranges, which come from our experience, not a dataset.
Once you've found the stage, our funnel conversion calculator shows what fixing it is worth in revenue.
Frequently asked questions
Sources
- 1.Education landing page conversion rates. Unbounce, 2024-11-05.
- 2.Handling duplicate Pixel and Conversions API events. Meta for Developers, accessed 2026-10-04.
- 3.Clarity FAQ. Microsoft Learn, accessed 2026-10-04.
- 4.Facebook advertising benchmarks. LocaliQ / WordStream, 2026-09-23.
- 5.Facebook ads benchmarks 2025. WordStream, 2025-09-15.
- 6.About ad relevance diagnostics. Meta Business Help Center, accessed 2026-10-04.
- 7.See how dynamic text on a landing page increased conversions by 31.4%. ConversionLab, 2024-12-16 (test 2017-18).
- 8.Message match and conversion rates. Moz, 2017-07-13.
- 9.2024 Conversion Benchmark Report. Unbounce, 2024-08-29 (modified 2024-09-04).
- 10.Engagement rate and bounce rate. Google Analytics Help, accessed 2026-10-04.
- 11.GA4 engagement rate benchmarks. Siege Media, 2026-08-26.
- 12.Milliseconds Make Millions. Deloitte / 55 for Google, 2020-03-24.
- 13.Email marketing benchmarks. GetResponse, 2024.
- 14.Clarity semantic metrics. Microsoft Learn, accessed 2026-10-04.
- 15.Cart abandonment rate statistics. Baymard Institute, 2025-09-22.
- 16.Email sender guidelines. Google (Gmail Help), accessed 2026-10-04 (rules effective 2024-02-01).
- 17.Sender best practices. Yahoo Sender Hub, accessed 2026-10-04.
- 18.Strengthening the email ecosystem: Outlook's new requirements for high-volume senders. Microsoft (Defender for Office 365 blog), 2025-04-02 (updated 2025-04-29).
- 19.Email Impact Report: email benchmarks. Sinch Mailgun, 2026.
- 20.2026 Email Deliverability Benchmark Report. Validity, 2026-03.
- 21.Messaging Principles and Best Practices. CTIA, 2023-05.
- 22.Webinar Benchmark Report 2026. Livestorm, 2026.
- 23.B2B lead response times. RevenueHero, 2024-03-20.
- 24.Lead Response Management Study (hosted copy). InsideSales.com / MIT (James Oldroyd), 2007 (copy dated 2008-07-17).
- 25.Ways to reduce no-show rates in sales calls. RevenueHero, 2025-08-18 (updated 2026-04-24).
Written by
Ray GillespieCo-Founder & COO
Ray runs day-to-day operations across every Victory engagement, building the systems, automations and AI-powered workflows that hold the machine together. He has overseen operations behind more than $120M in revenue.
Part of the guide: Funnel CRO: Benchmarks, Diagnostics and Tests for Coaching, Course and Event Funnels