Event Marketing for Coaches and Experts: Fill the Room, Raise Show Rates and Monetize Free Events
Free events earn money in four steps: seats, registrations, show rate, sales. The show-rate system we run, and the 2026 data behind each lever.
 Ray GillespieCo-Founder & COO
Published 19 min read
On this page
- The show-rate scoreboard: define it before you measure it
- Why the usual numbers mislead
- Fill the room with the right people
- Bridge sign-up to doors open
- Free, paid, VIP or deposit
- Format: one day beats three when it's free
- Monetize the room
- Build the budget backwards from the seats
- How we run this at Victory
- Common mistakes
Key takeaways
- A free event earns money in four steps: seats, then registrations, then show rate, then VIP and stage sales. Most promoters only manage the second one.
- In our experience, a well-run free one-day event shows 35% to 45% of registrants. The best public dataset says about 72% check-in for free events, but it describes warmer audiences than cold ad traffic.[1]
- Paid events show up better (about 17% median no-show against 28% for free), yet inside the same event, paying guests attend only 2 to 4 points more reliably than comped ones.[2] The event's design does most of the work.
- The confirmation page, the ticket, the reminders and inbox placement are part of the funnel. Treat them as admin and the ads get blamed for a delivery failure.
- Build the budget backwards from the seats, and judge every dollar on cost per checked-in attendee and sales from the room.
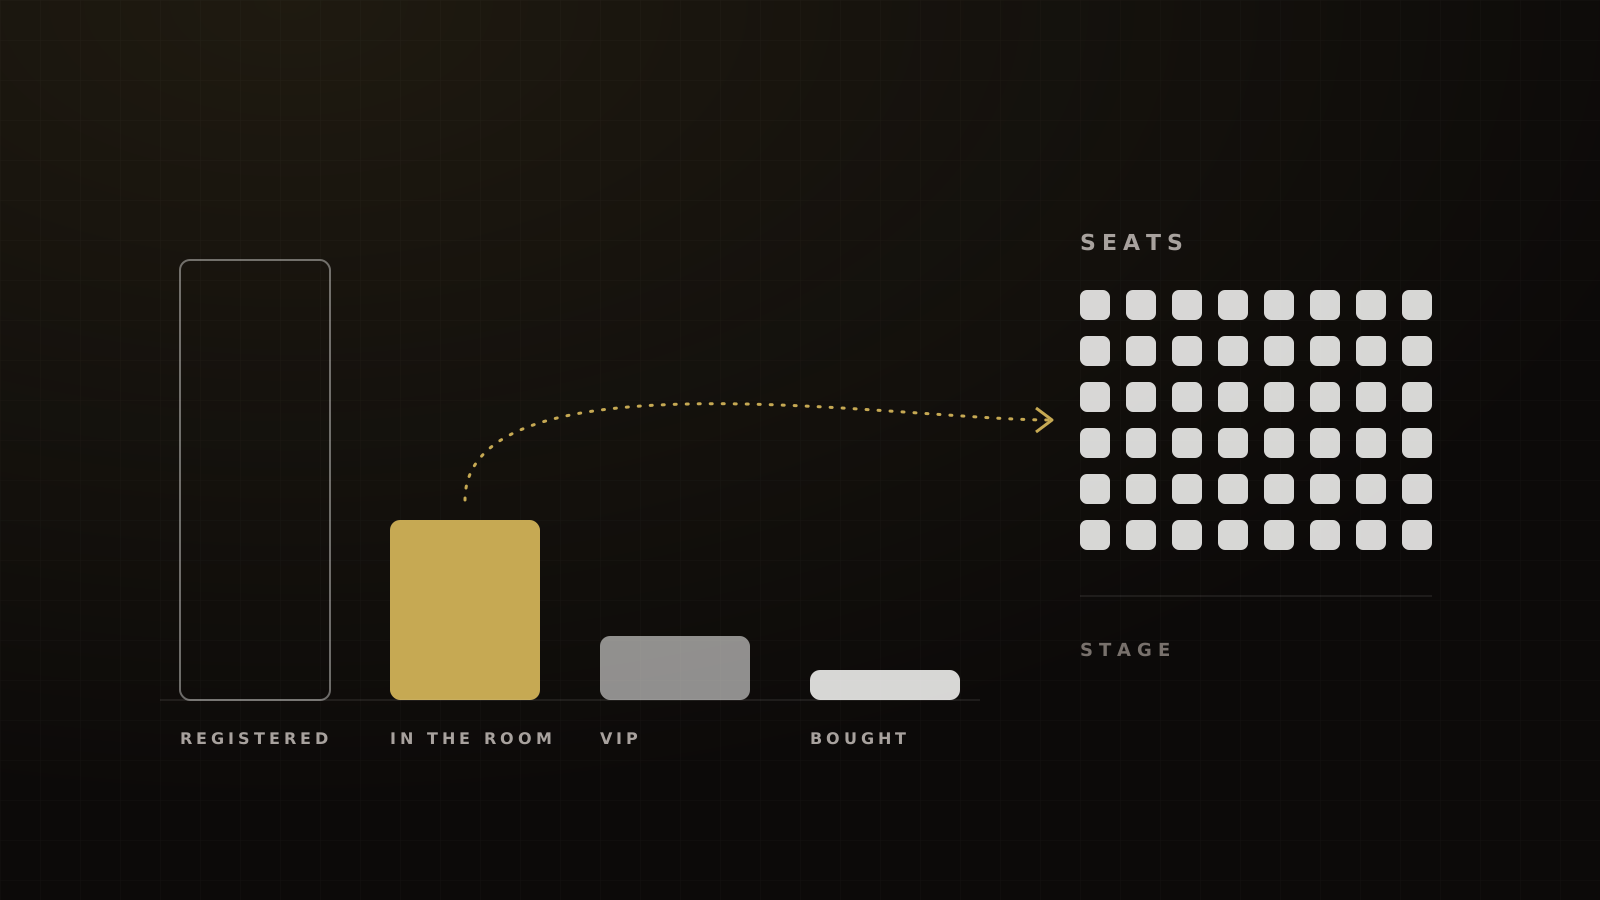
A free event earns money in four steps. You set the seats you need filled. You buy the registrations to fill them. A share of those registrants shows up. Then a share of the room buys, first a VIP upgrade and later the offer from stage.
The step most promoters ignore is the third one. They watch cost per registration every day of the promotion and find out the show rate when they count heads at the door. By then the budget is spent.
When we run a free one-day in-person event well (a short promo window, a steady reminder cadence and a confirmation page with every detail), 35% to 45% of registrants show up. That number is the hinge of the whole plan. It sets how many registrations you need, what each person in a seat really costs, and how many buyers you can expect in the room.
Registrations aren't attendance. Show rate is a systems problem, and it's mostly solved by things nobody thinks of as marketing.
That show rate, it's all systems.
This guide covers the whole system the way we run it: how to measure show rate honestly, how to fill the room with the right people, how to get them from sign-up to doors open, when to charge, which format to choose, how to sell from the room, and how to build the budget from the seats backwards.
The show-rate scoreboard: define it before you measure it
Two promoters can both say "we had a 50% show rate" and mean completely different things. Before you compare yourself to anyone, pin down what's being counted.
Registrants, attendees, check-ins, live vs replay
Four questions decide what a show-rate number means:
- What's the denominator? Registrations, tickets, unique people or "expected attendees"? A person who registers twice, or buys four tickets, changes the math.
- What counts as showing? A badge scan at the door, joining a webinar for one minute, staying to the pitch, or watching the replay later?
- Median or average? A few huge events can drag an average far from what a typical event sees.
- Whose registrants? A house list of past buyers and a cold audience from paid social aren't the same population.
For in-person events we count unique registrants who checked in at least once, divided by unique registrants. For webinars we count unique live attendees divided by unique registrants, and we report replay views separately. That keeps our numbers honest against each other.
What the best data says
The best recent in-person dataset comes from PheedLoop, an event platform that published check-in data from more than 1,070 live events in April 2026. The median no-show rate was about 28% for free events, about 17% for paid events and about 20% overall.[1]
Median no-show rate at free vs paid live events, across 1,070+ events
Room size matters too. Events of 10 to 49 expected attendees had a median no-show of about 32%, and small free gatherings about 37%. Rooms of 150 or more came in near 19%.[1]
Webinar platforms publish a different number: live attendees divided by registrants. Goldcast's 2026 report puts the average B2B single-session webinar at 40% for 2025, up from 33% in 2024, across 26,190 webinars from 522 organizations.[3] Livestorm reports a 47.7% live show-up rate across 33,786 sessions and 7.06 million registrations in 2025.[4] The same Livestorm report also labels 51.3% an average show-up rate without reconciling the two, so quote 47.7% with care.
Bizzabo's 2026 benchmarks show why denominators matter. It reports a "52% average attendance rate", but its own averages (269 attendees from 412 registrations) work out to about 65%.[5] Neither number is wrong on purpose. They're averaged differently, and Bizzabo doesn't say how.
Here is how those figures sit next to what we see on the funnels we run.
| Format | Industry figure | What we typically see |
|---|---|---|
| Free in-person event | ~72% check-in (~28% median no-show)[1] | 35–45% of registrants, free one-day, cold paid social |
| Paid in-person event | ~83% check-in (~17% median no-show)[1] | 85–90% for VIP tickets at $100–$297 |
| Webinar, warm or house list | 40% (Goldcast) to 47.7% (Livestorm), mostly B2B[3][4] | 40–50% live |
| Webinar, cold paid traffic | Not separated in the public data above | 25–35% live, single-date evening webinar |
| Free three-day event | No published curve | 10–15% of unique registrants attend at least one day |
Industry rows are platform data with the samples shown in the text. Victory rows are operator estimates from our experience, not a dataset.
Our free number sits well below PheedLoop's, and we think the reason is the population. Organizers on an event platform mostly fill rooms from an audience they already have: members, customers, employees, invited guests. PheedLoop's denominator also includes people who didn't register. Our free events are filled from paid social, by people who saw an ad a few days ago. That's reasoning, not a measured fact, but it's the reason we tell clients: if someone quotes you a 70% free-event show rate, ask whose registrants they were.
Why the usual numbers mislead
Most show-rate figures on page one of Google have no data behind them. A few to stop repeating:
- "Free events see 40% to 60% no-shows; paid events about 10%." Eventtia publishes this range and sources it to other roundups, not to a study.[6] We traced it further in our event statistics roundup and found nothing original at the end.
- "In-person events average 65% attendance; free about 50%; paid 70% to 90%." Eventbrite publishes these and calls them ballparks itself. There's no sample or method.[7]
- "A $5 ticket cuts no-shows to 15%; $10 or more cuts them below 5%." That's one organizer's experience, reported by Localist in 2021.[8]
- "98% of texts get opened." SMS has no open event to measure. Omnisend, which publishes SMS benchmarks from hundreds of millions of sends, says so and reports clicks instead.[9]
They may be roughly right. They're not evidence, and a budget built on them will be wrong in a predictable direction: too optimistic.
Fill the room with the right people
The goal of event ads isn't registrations. It's registrants who will show up and who could buy. Those are different targets, and optimizing for the first one quietly hurts the other two.
Registration-page conversion
Bizzabo's 2026 data puts event registration pages at 21.5% of visits converting, with dynamic multi-step flows at 24.4% against 11.6% for static ones.[5] On cold Meta traffic, our free event and webinar registration pages typically convert 22% to 30% of visitors. That's in line with Bizzabo's figure, which comes from its B2B platform data.
Flow design matters more than most people think. Bizzabo's spread between dynamic and static flows is a factor of two from the form alone.
Friction is a filter, not a bug
Alex Hormozi makes the case that friction raises lead quality, and that you tune it to the volume you need. A form with zero questions gets the most registrations and the weakest ones.
We add two or three soft qualifying questions to free event forms: what the person does, what they want from the day, sometimes a rough business size. Our rule of thumb is that this costs no more than 10% of registrations. There's no credible public benchmark for that figure, so treat it as ours. What it buys is a room you can sort before it fills: who to seat near the front, who the sales team should meet, who's there for the free lunch. We go deeper on this in our guide to qualifying event attendees.
Jason Fladlien makes a related point about webinars in his course material: opt-ins that are too easy hurt show rate, because a registration that cost nothing means nothing. We agree with the direction. We just don't add friction that the data doesn't pay for.
Message match from ad to room
The ad sets the promise. The registration page repeats it. The confirmation page makes it concrete. The event delivers it. When any one of these drifts (the ad says "free masterclass", the room gets a three-hour pitch), the show rate of the next event drops, because the people who came talk to the people who didn't.
Bridge sign-up to doors open
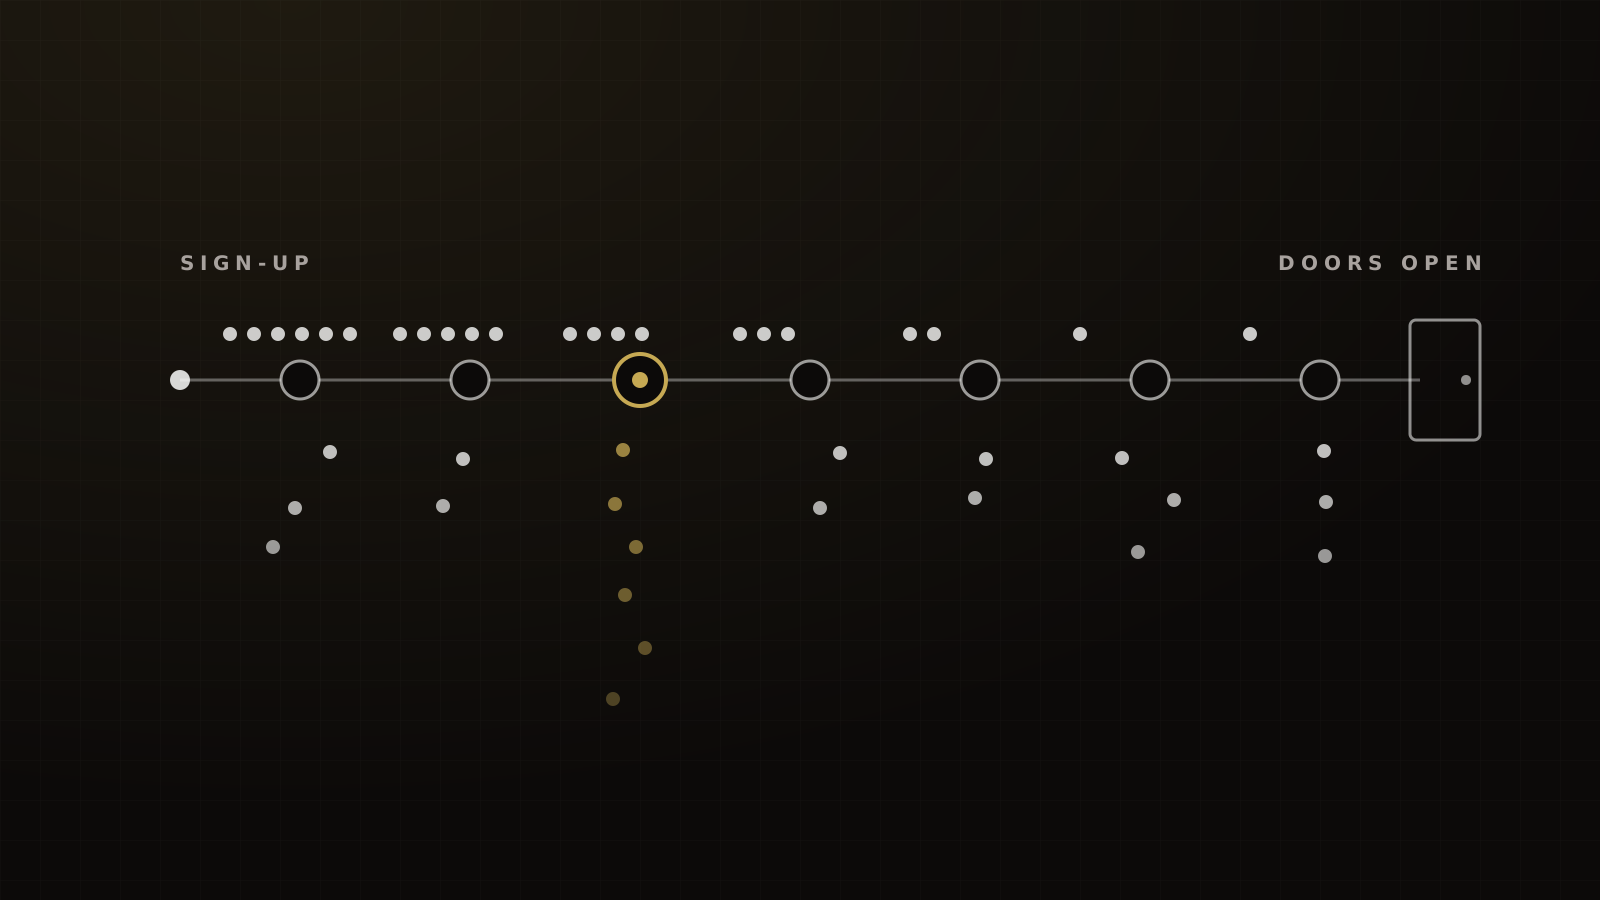
This is where most show rate is won or lost. Five levers sit between "registered" and "in a seat", and every one of them is owned by someone other than the media buyer.
Short runway
The longer the gap between sign-up and the event, the more people forget, double-book or lose interest. Livestorm's 2026 data shows that 49.6% of webinar registrations land in the final week, and 15.3% on the day itself.[4] People register late whatever you do. Maritz found that 43% of conference-goers register within the four weeks before the event, and those are events people travel to.[10]
Our defaults:
- Free in-person event: 10 to 14 days of paid ads, with warm email and SMS starting about 21 days out.
- Weekly evening webinar: ads only in the 2 days before. Running ads two weeks out raises cost per registration and lowers the show rate.
That second rule is behind our lowest-ever webinar cost per registration. On a weekly evening webinar program, with ads running only in the 2 days before at a few thousand dollars a day, our current best is $4 to $5 per registration, against a historical best of $8 to $10. That program returns 4x to 7x ROAS week over week. The full calendar, with the day-of cadence, is in our event reminder schedule.
The confirmation page
The confirmation page is the first thing a new registrant sees and the page they come back to when they've forgotten the details. It should answer every question a person has on the morning of the event:
- the date, start time, end time and time zone
- the full address, parking, the nearest entrance and what to bring
- what they'll get from the day, in specifics
- the agenda, with times
- the ticket or join link, with a one-tap way to save it
- a way to text the team, so the first SMS comes from them, not from you
We go through the page block by block in what to put on a thank-you page.
A rushed launch with a thin confirmation page is one of the most common reasons we see a full registration list turn into a half-empty room.
The ticket
A ticket is a commitment device and a delivery channel. We issue Apple Wallet and Google Wallet passes for in-person events. Apple's event ticket passes can surface on the Lock Screen at the right time and place, and they can be updated after issue with a push.[11] Google's event tickets support entry by barcode, QR code or NFC, plus real-time notifications and event updates.[12]
Be honest about what that does. No credible study shows a Wallet pass raises attendance on its own. In our experience, 40% to 55% of registrants add the pass when it's offered on the confirmation page and in the confirmation text and email. That's a pass-save rate, not a show rate.
The value is the signal. We can see who saved the ticket and who didn't, and the people who didn't go into a follow-up sequence. At the door, the scan tells us exactly who came. Our Apple and Google Wallet tickets guide covers the setup and the automation.
Reminders: what the experiments show
Every reminder guide says "send more reminders". The few controlled experiments on events say something more useful.
In a 2021 randomized test by Sister District (now States Win), every registrant already received automated email and text reminders from the event platform. Adding one more personal text made no difference: 56.16% attended against 55.78%, with a p-value of 0.947 across 293 RSVPs.[13]
An earlier Sister District test went the other way. Personal confirmation by call or text raised attendance by about 51% in relative terms against email-only confirmation, at volunteer events.[14] The sample was small and the setting is volunteers, not buyers, so treat it as a direction.
Read together, the lesson is clear. Once a working automated cadence exists, more of the same adds little. What moves the number is a reminder that arrives, at the right moment, and personal contact on top. That's why we put our effort into deliverability and day-of timing before we add a sixth automated text.
Deliverability is attendance
A reminder that lands in spam, or gets filtered by a carrier, is a reminder you didn't send. And it fails silently: the platform says "sent", the dashboard looks fine, and the room is empty.
On email, Gmail and Yahoo have enforced bulk-sender rules since February 2024. If you send more than 5,000 messages a day to Gmail, you need SPF, DKIM and DMARC, one-click unsubscribe, and a spam rate below 0.30%. Google says to aim below 0.10%.[15] Yahoo requires unsubscribes to be honored within 2 days.[16] A big free-event list hits those thresholds fast.
On SMS, there's no open rate to watch. Omnisend's 2025 ecommerce data puts SMS campaign click-through at 12.39% and automation click-through at 20.34%.[9] Those aren't event figures, but they give you a sanity check: if your reminder links get a fraction of that, look at delivery first.
The worst failure we've seen started with one first text carrying a raw link, sent to a whole registrant list at once. Carriers filtered it, the failures locked the account's outbound SMS, and a day of reminders never went out. On our post-mortem call the verdict was blunt: the failed texts "literally hurt our attendance rate so much." The post-mortem and trigger-link fix is worth reading before your next send. Our target after that fix is 95% or more of reminder texts delivered. The broader rules are in our email and SMS deliverability guide.
Free, paid, VIP or deposit
Charging for a ticket raises the show rate. That much is clear from PheedLoop's data: about 17% median no-show for paid events against 28% for free.[1] In our experience, paid VIP tickets in the $100 to $297 range show 85% to 90%, in line with PheedLoop's roughly 83% check-in for paid events.
The nuance is in PheedLoop's follow-up. Across 195 events that sold some tickets and comped others, paying guests attended only 2 to 4 percentage points more reliably than non-paying guests at the same event.[2] PheedLoop calls that a directional result.
That changes how to think about pricing. The big free-vs-paid gap is mostly about paid events, not paid people. Paid events tend to have a defined audience, a concrete promise and a specific agenda. Copy those into your free event and you close part of the gap without charging anyone.
The deposit option
Jason Fried's Basecamp breakfast is the cleanest public example of charging to raise attendance. He asked for a $100 deposit, refunded at the door. 55 people signed up and 50 came. An earlier free RSVP for a similar event drew 84 sign-ups and 38 attendees.[19] Skift Meetings summed it up as registrations down about 35% and attendees up about 32%.[20]
It's a strong result, from one event against another. And a refundable deposit earns nothing toward your ads, because the money goes back at the door.
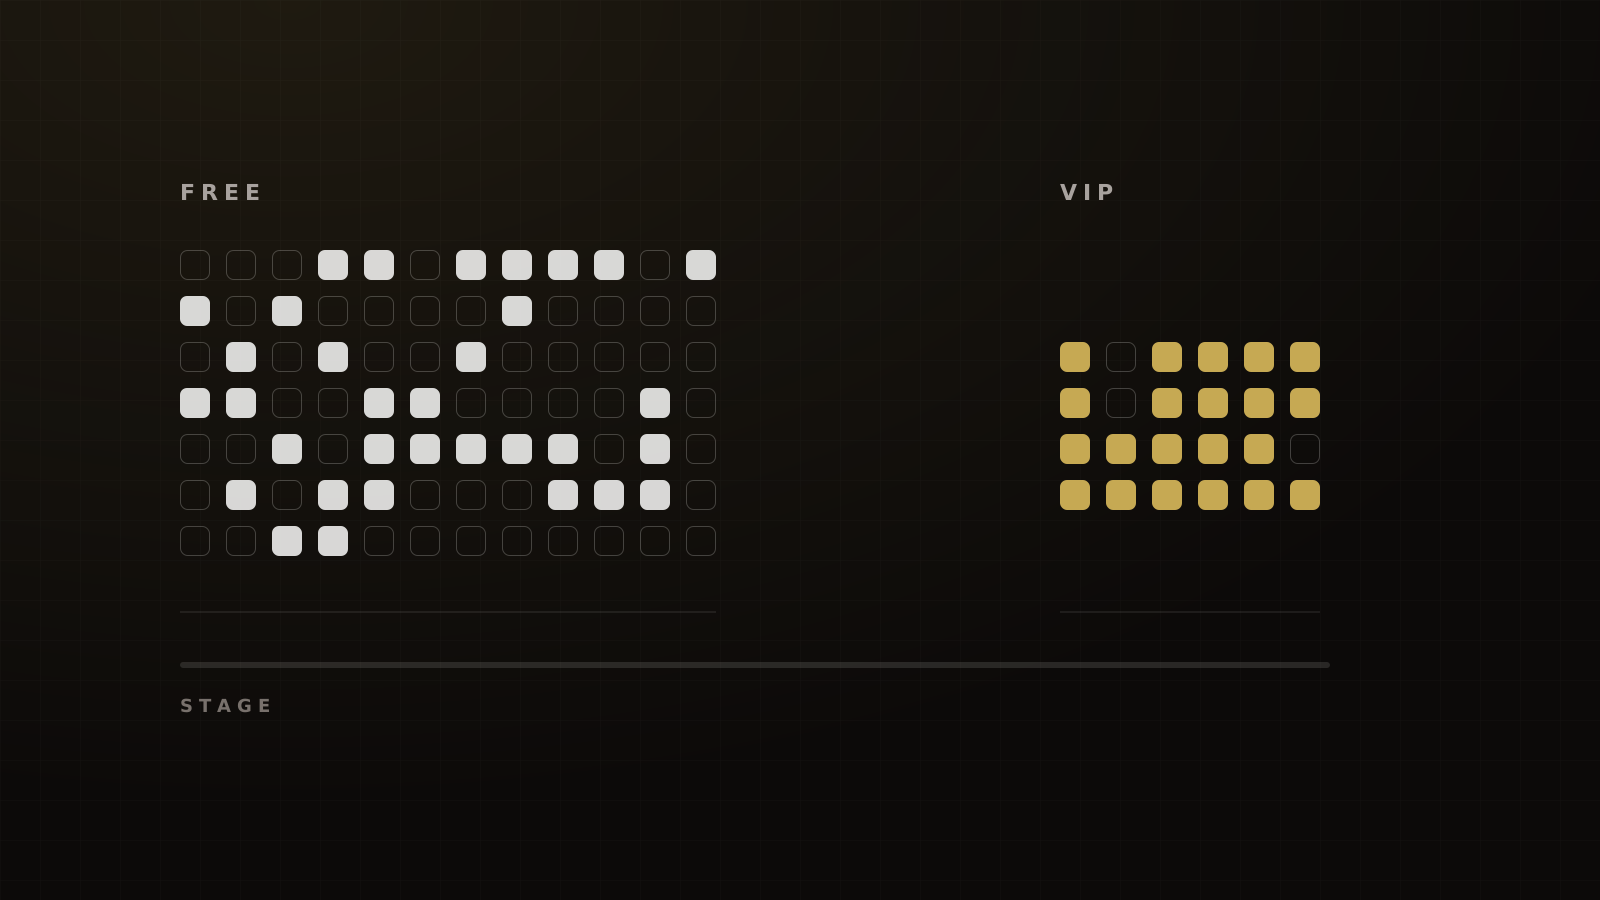
Why we run free plus VIP
Russell Brunson's Invisible Funnel, which takes a card at webinar registration, and Hormozi's case for a paid first step both point at the same idea: a small payment changes who shows up. We apply it as a split.
Most of the ad budget buys free registrations for volume. A smaller slice sells a VIP upgrade, on the confirmation page and with its own ads. Our house standard is that VIP ticket revenue, net of fees and refunds, recovers 100% or more of VIP ad spend. There's no industry benchmark for that; it's the rule we hold. The result is a room seeded with people who've already bought once, at roughly zero net cost. The full model, with a worked example, is in our free vs paid event tickets guide.
Format: one day beats three when it's free
A free event asks for time, not money. The more time it asks for, the fewer people pay it.
In our experience, a free three-day event shows 10% to 15% of unique registrants on at least one day, against 35% to 45% for a free one-day event. No published industry curve for multi-day free events exists, so that comparison is ours. It matches what we hear on almost every call with a promoter who has tried both.
Our house rule for a free one-day event is about five hours of content. That's a rule, not a statistic. A free attendee will give you an afternoon. They rarely give you a weekend.
Multi-day still has a place. Paid multi-day events, community programs and cohorts work, because the commitment was made at checkout. Circle's 2024 creator survey is a useful hint: 59% of its top-10% creators said their events drew more than 50% attendance, against 33% of other creators.[21] That's a share of creators, not a show rate, and it's about two years old. But it says an engaged community shows up in a way a cold list doesn't. We cover the trade-offs in one-day vs multi-day events.
Monetize the room
A free event you pay to fill has to sell something. Splash's 2025 survey of 1,058 US marketers found that 88% call events a key revenue driver, and 66% of those running several formats said in-person events generated the most revenue.[22] Those are B2B marketers, not coaches, and it's self-reported. The instinct is still right: the room is where the money is.
How we structure the sale:
- One offer from stage. One clear next step, presented once, with a deadline that's real. Two offers split the room.
- VIP seating first. The people who bought VIP are your warmest buyers. Seat them where the speaker can see them, and brief the sales team on who they are before doors open.
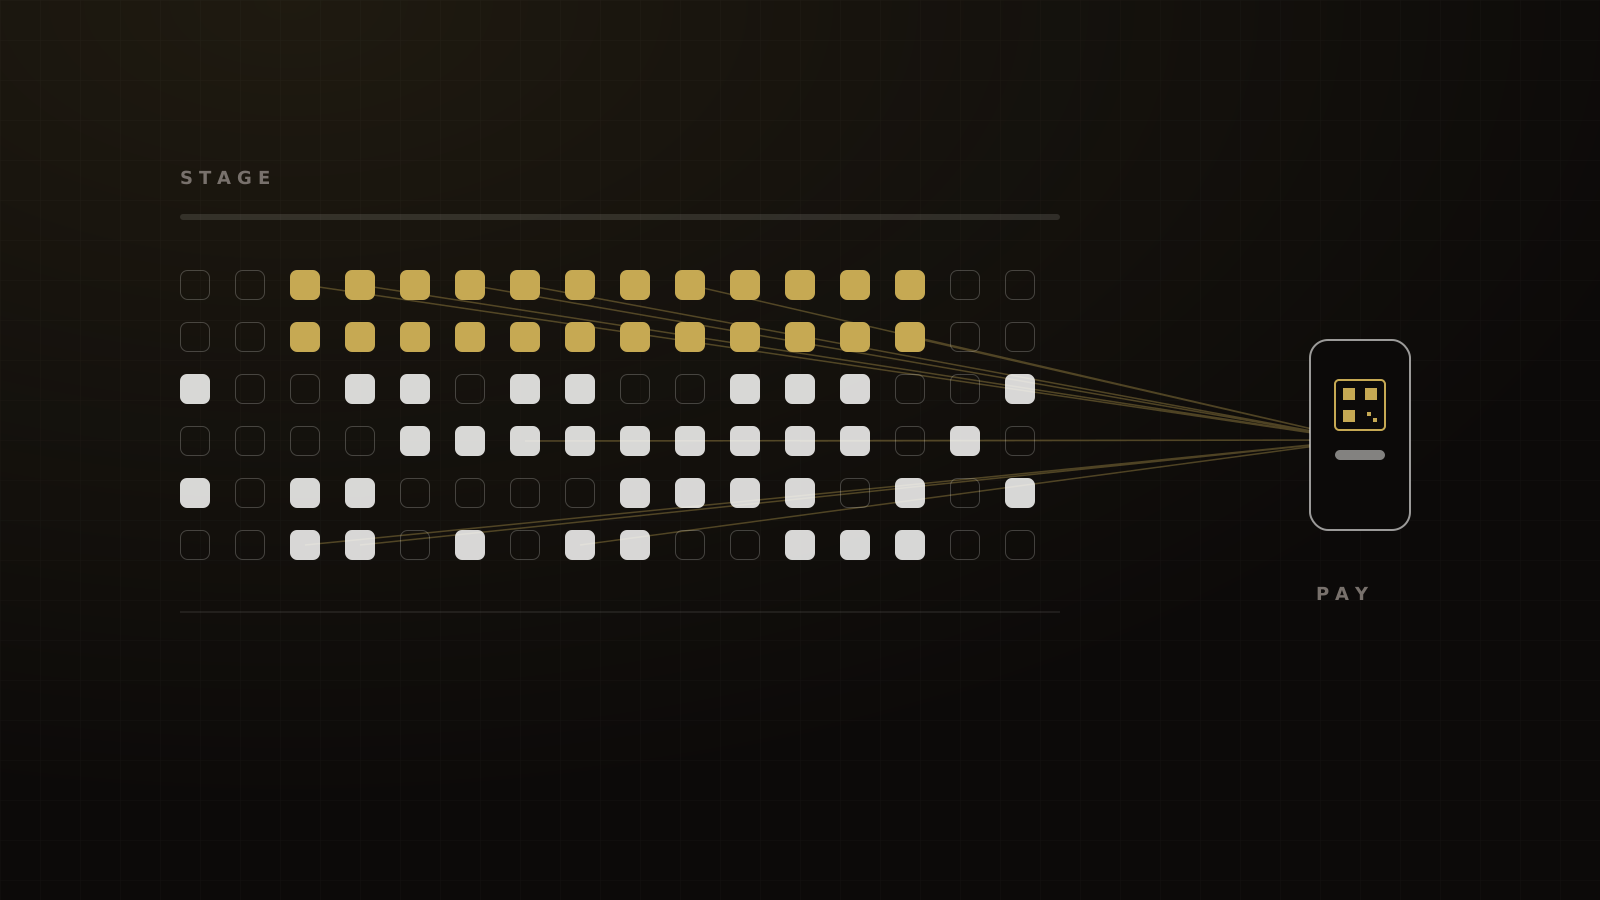
- Text-to-pay or a short checkout link. The fewer taps between "yes" and paid, the more of the room's intent turns into sales.
- A sales team on the floor. Questions get answered in the room, not in a follow-up email three days later.
- A next-day session for buyers. A kickoff the morning after gives new buyers a reason to stay bought. Our target on event sales with a next-day kickoff is a dispute ratio under 0.5% of transactions.
The target we hold for a free one-day event is 8% to 12% of attendees buying the main stage offer. There's no credible public benchmark for that, and it depends heavily on the offer and the price. Sales made at a temporary venue can also fall under the FTC's Cooling-Off Rule, which we cover in our guide to selling from stage.
The point of the show-rate work is here. Every extra person in a seat is another chance at a sale. On a 300-seat plan, moving from a 35% to a 45% show rate means buying about 190 fewer registrations for the same room: roughly $3,400 to $4,600 of ad spend at the cost per registration we typically see.
Build the budget backwards from the seats
Most event budgets start with the ad spend and hope the room fills. Ours start with the room.
Framework
The seats-first event budget
- Set the seat target. How many people do you need in the room for the stage sale to work?
- Divide by your real show rate. At 35% to 45%, that's roughly 2.2 to 2.9 free registrations per seat. Use your own number once you have one.
- Multiply by your cost per registration. In our experience, a free in-person event registration from Meta costs $18 to $24.
- Fund the VIP side separately, to break even. VIP ticket revenue should cover VIP ad spend.
- Check the promise. Confirmation page, ticket, reminders and deliverability all need to be in place before the ads start, because they set the show rate you just planned around.
- Judge on cost per checked-in attendee. Track it every day of the promotion, not at the door.
Victory's planning model for free one-day events. The friction principle is credited to Alex Hormozi; card-at-registration to Russell Brunson.
A worked example (illustration, not a client result)
Say you need 300 people in a room. The figures below come from our ranges above and are rounded.
| Line | Low case | High case |
|---|---|---|
| Show rate | 35% | 45% |
| Free registrations needed | ~860 | ~670 |
| Cost per registration | $24 | $18 |
| Free-side ad spend | ~$20,600 | ~$12,100 |
| Cost per checked-in attendee | ~$69 | ~$40 |
| Stage buyers at 8–12% of 300 | 24–36 | 24–36 |
Built from our operating ranges, not from a client event. Swap in your own show rate and cost per registration.
The spread is the lesson. The same room costs roughly $12,000 or $20,600 depending on show rate and cost per registration. The show-rate levers in this guide are usually cheaper to fix than the ad costs. Our event budget calculator runs this math with your inputs.
How we run this at Victory
The same system carries over to virtual events. For webinars, the levers are identical and the numbers change: our webinar funnel guide covers the cold-traffic version, where we typically see 25% to 35% of registrants live. If you'd rather have us pressure-test your plan against these numbers, book a strategy call.
Common mistakes
- Planning on someone else's show rate. A 72% figure from warm audiences will under-buy registrations for a cold-traffic event by half.
- Judging the campaign on cost per registration. A cheap registration that doesn't show is the most expensive one you bought.
- Promoting too early. Paid ads weeks out buy registrants who forget. Warm lists can start earlier; cold ads shouldn't.
- Treating the confirmation page as a receipt. It's the page people return to on the morning of the event. Put everything on it.
- Blasting the first text with a link. One filtered send can stop every reminder on the account.
- Running a free event long. Three free days ask for more time than most cold registrants will give.
- Selling more than one thing from stage. Two offers split the room and both close worse.
- Charging to fix a weak promise. Paid events show up better mostly because they're designed better. Fix the promise first.
For the full diagnosis of where registrants drop off, read why people register and don't show up.
Frequently asked questions
Sources
- 1.Event Data Lab #05: no-show rates by ticket type and event size. PheedLoop, 2026-04-29.
- 2.Event Data Lab #06: registration completion and paying vs non-paying guests (with addendum). PheedLoop, 2026-05-26, addendum 2026-09-01.
- 3.2026 B2B Webinar Benchmark Report. Goldcast, 2026.
- 4.Webinar Benchmark Report 2026. Livestorm, 2026-09-01.
- 5.Event Program Benchmarks 2026. Bizzabo, 2026-03-05.
- 6.How to prevent no-shows at your events. Eventtia, 2025-08-18.
- 7.How to increase event attendance. Eventbrite, 2024-10-23.
- 8.Should I charge for my event?. Localist, 2021-03-09.
- 9.SMS marketing benchmarks 2026: campaigns vs automations. Omnisend, 2026-06-11.
- 10.Registration Insights Report. Maritz, 2024.
- 11.Get started with Wallet. Apple Developer, undated, checked 2026-10-04.
- 12.Google Wallet tickets. Google for Developers, undated, checked 2026-10-04.
- 13.You don't have to tell me twice: additional text message reminders for confirming volunteer attendance. Sister District Project (now States Win), 2021-05-18.
- 14.Call (or text) your girlfriend: personal contact works better than just email to recruit and confirm volunteers. Sister District Project (now States Win), 2019-05-07.
- 15.Email sender guidelines. Google Workspace Admin Help, effective 2024-02-01.
- 16.Sender best practices. Yahoo Sender Hub, effective 2024-02.
- 17.The 1-to-1 consent rule is no more. Nelson Mullins, 2025-01-29.
- 18.CAN-SPAM Act: a compliance guide for business. Federal Trade Commission, 2023-08, edited 2024-01.
- 19.$5,300 in $100s: the verdict. Jason Fried, HEY World, 2026-08-28.
- 20.The $100 experiment that slashed no-show rates to just 10%. Skift Meetings, 2026-09-02.
- 21.2024 Community Benchmark Report: Creators. Circle, 2024.
- 22.Splash's 2025 outlook: 88% of marketers identify events as a key revenue driver. Cvent (Splash press release), 2025-03-27.
Written by
Ray GillespieCo-Founder & COO
Ray runs day-to-day operations across every Victory engagement, building the systems, automations and AI-powered workflows that hold the machine together. He has overseen operations behind more than $120M in revenue.