Event Budget Calculator: How Many Registrations (and How Much Ad Spend) It Takes to Fill a Room
Work backwards from the seats: show rate gives you registrations, cost per registration gives you the budget. The seat-first calculator we use.
 Ray GillespieCo-Founder & COO
Published 8 min read
On this page
Key takeaways
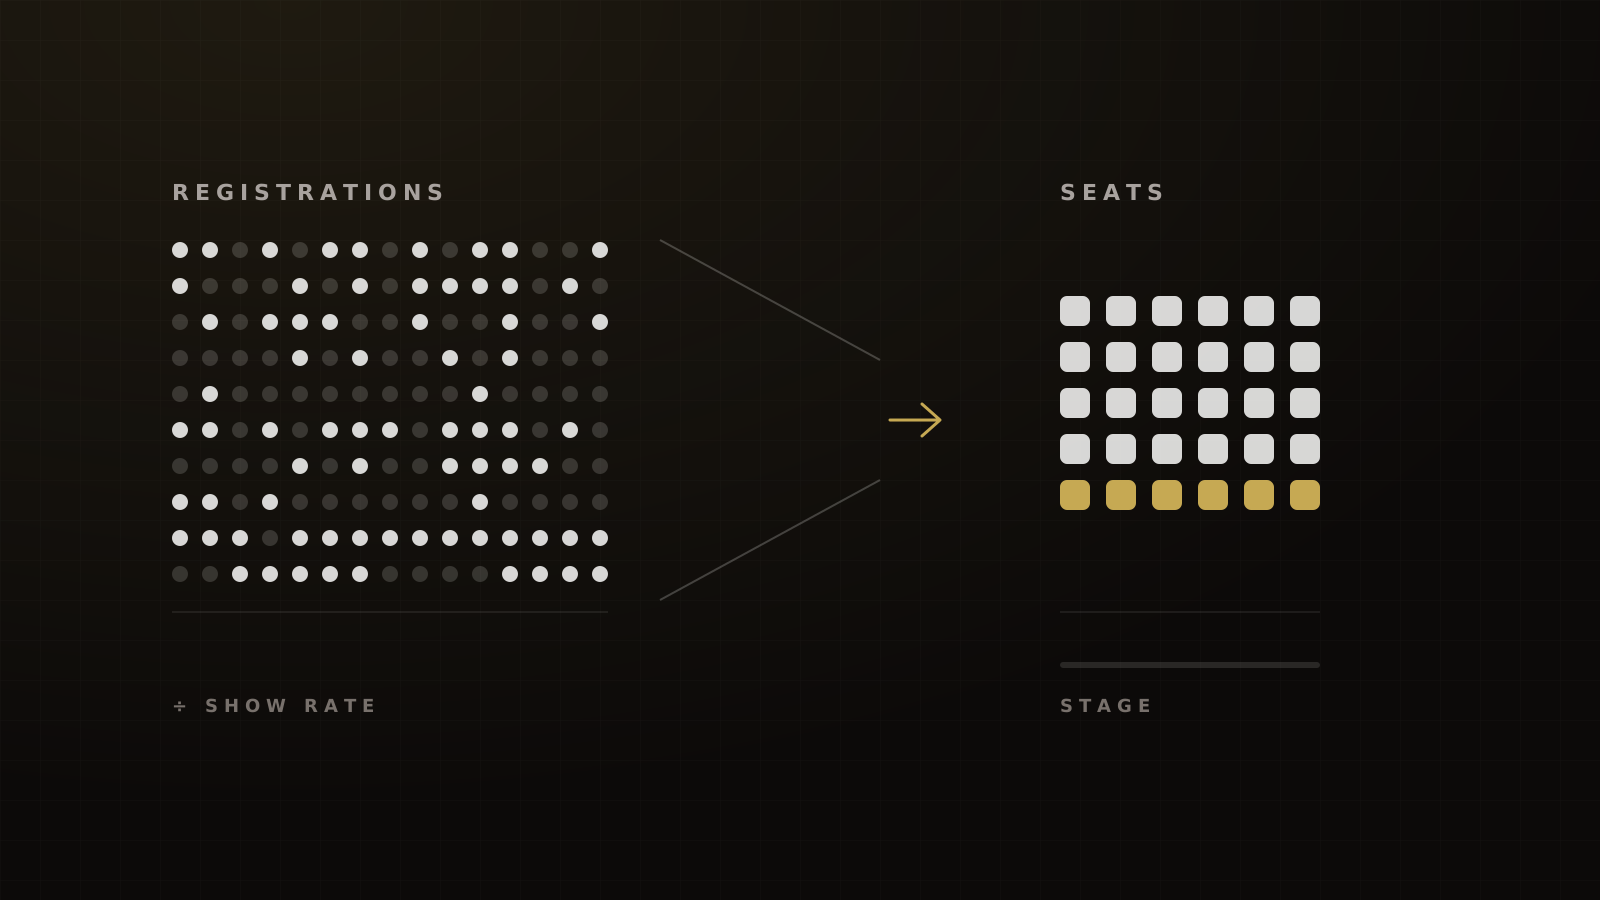
- Build the budget backwards: seats ÷ show rate = registrations, and registrations × cost per registration = ad budget.
- Run that math separately for free and VIP tickets. They show up at very different rates.
- On well-run free one-day events we typically see 35% to 45% of registrants show. That's 2.2 to 2.9 registrations per seat.
- Platform medians (about 72% check-in at free events) mostly reflect warm audiences. Use them for cold paid traffic and you will underbudget by roughly half.[1]
- Before you set any number, ask one question: have you ever broken even on a previous event?
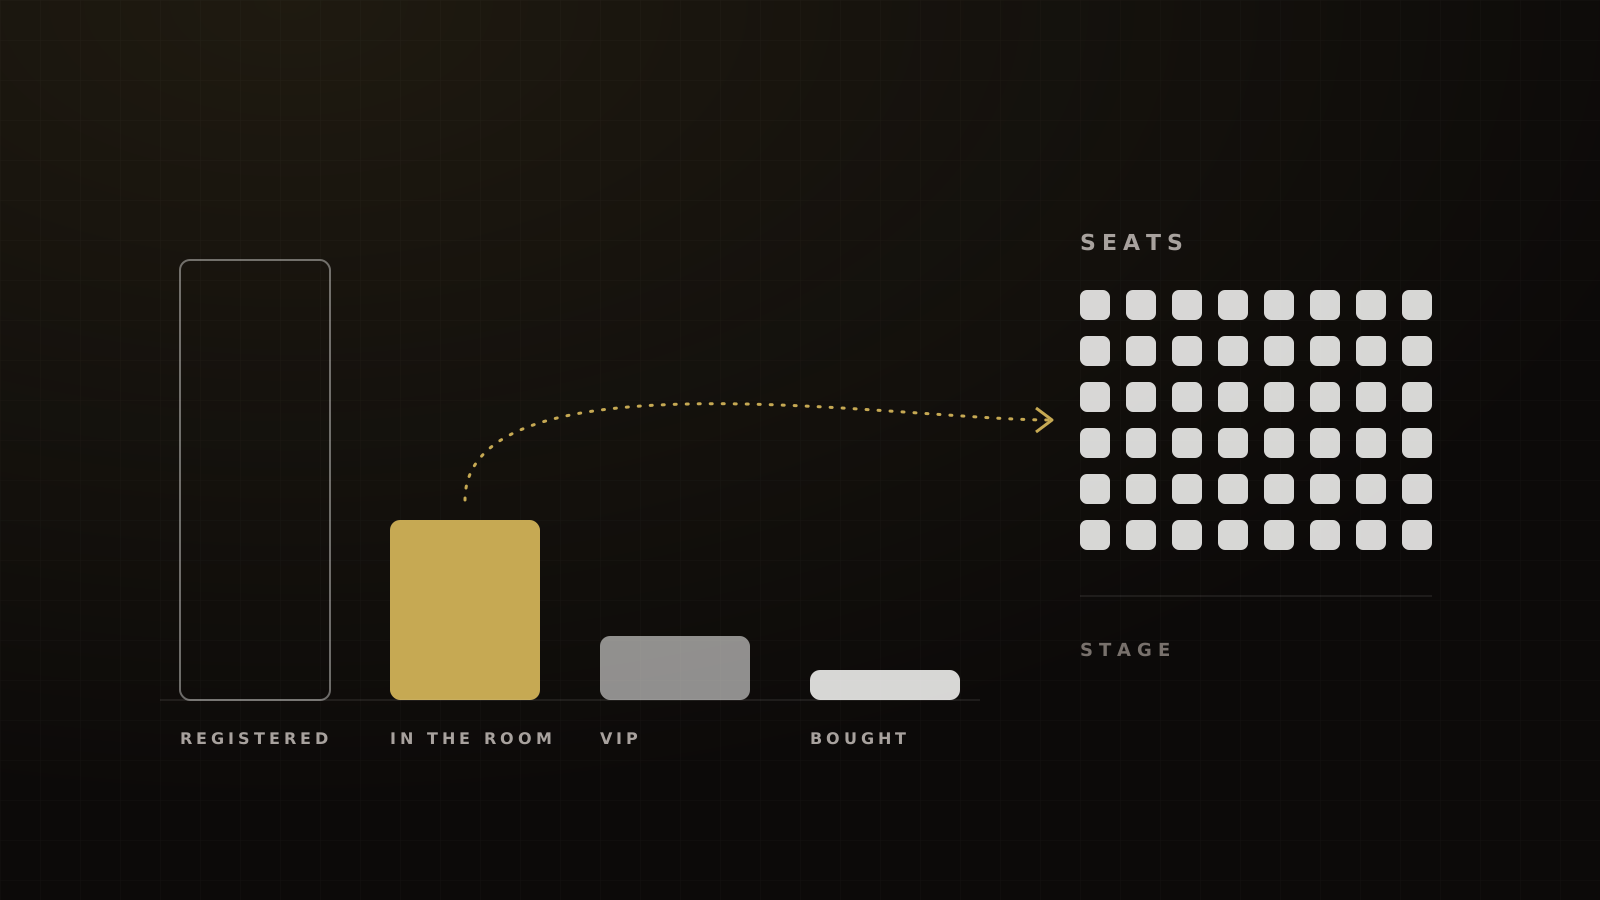
Work backwards from the seats. Divide the seats you need filled by the share of registrants you expect to show. That gives you registrations. Multiply registrations by what each one costs you. That gives you the ad budget.
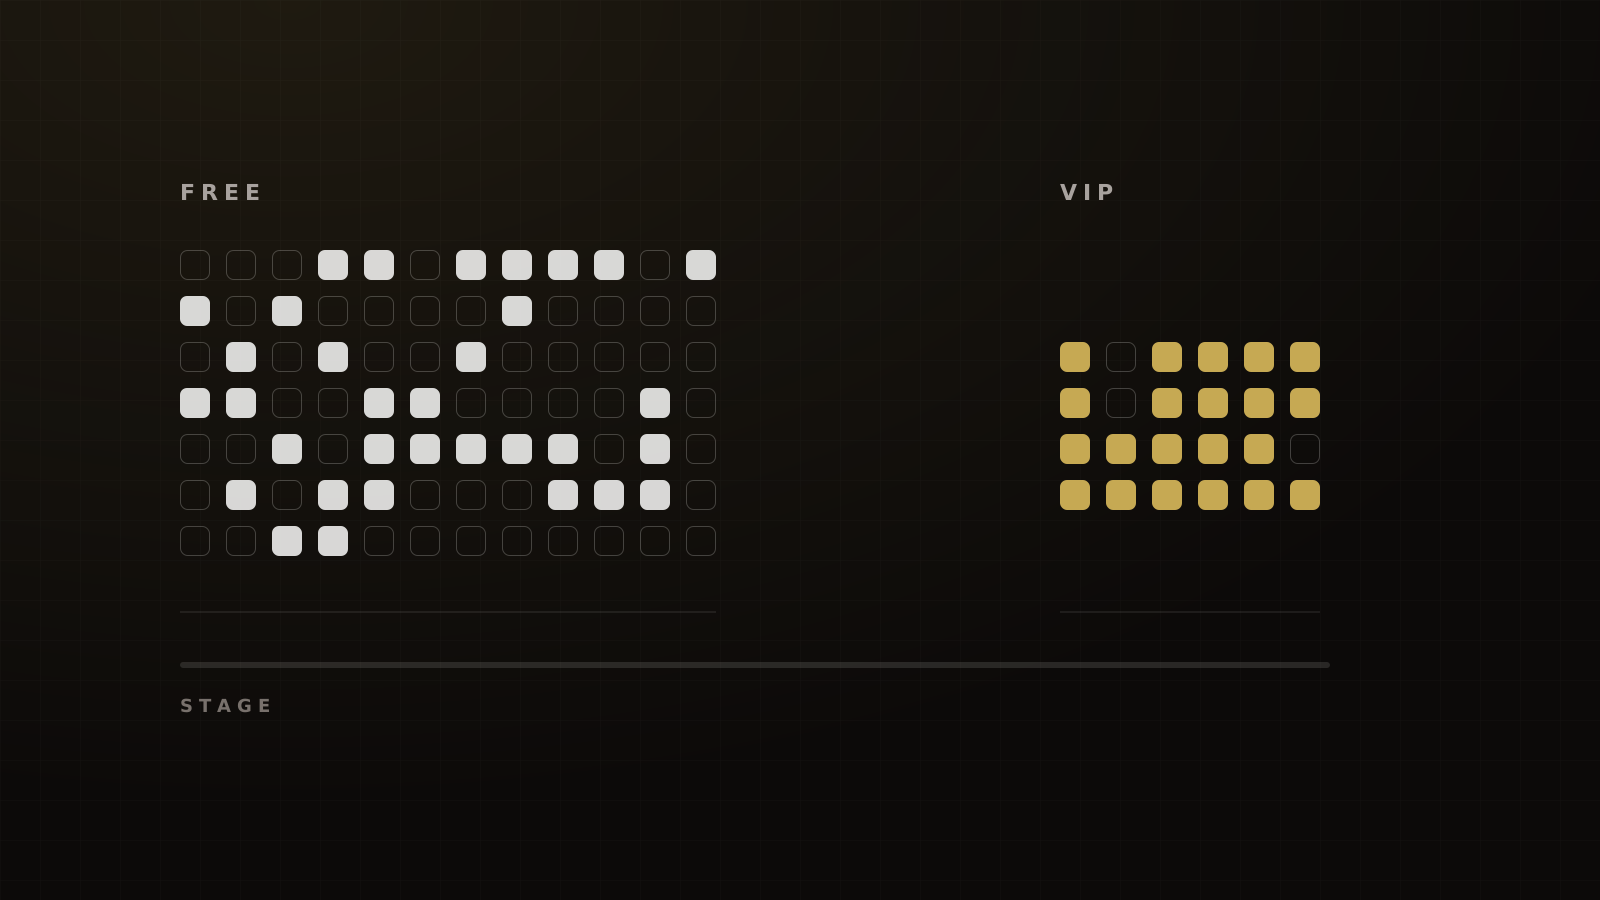
Do it twice: once for free tickets and once for VIP tickets, because they show up at different rates. Then seed every input with your own past events, not with averages or hopes.
Every event budget calculator on page one of Google adds up venue, catering and AV. None of them tells you how much demand you need to buy. This one does.
The first question: have you broken even before?
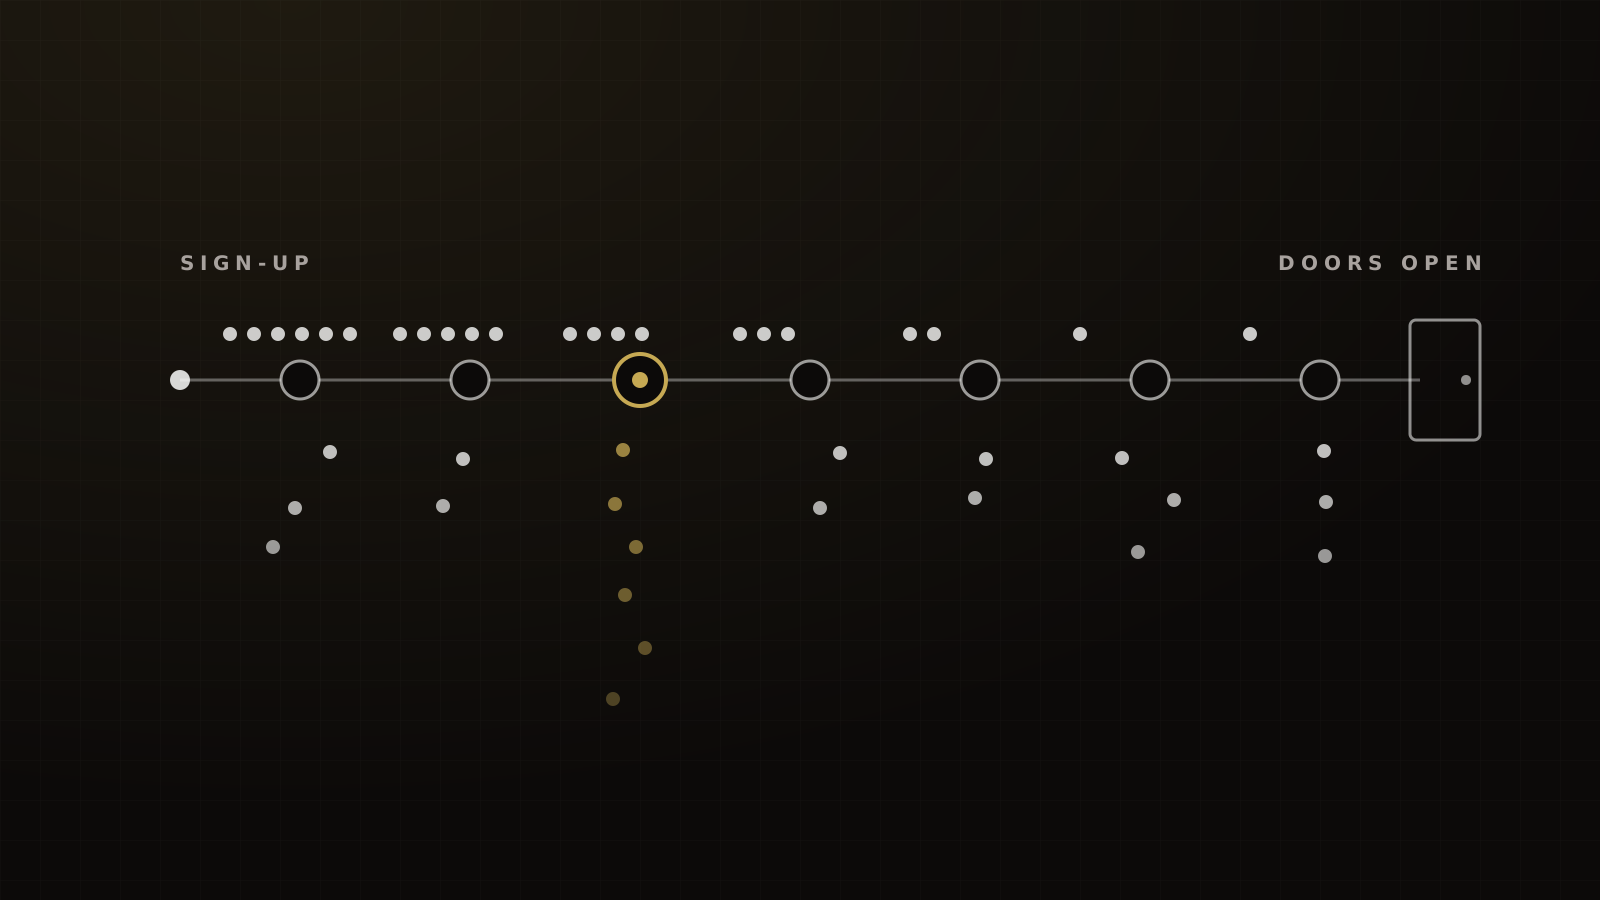
Before we touch a single input, we ask whether the event has ever broken even. If the answer is no, the budget isn't the problem yet. The offer, the show rate or the sale from stage is.
If the answer is yes, we have what matters most: a real show rate, a real cost per registration and a real conversion rate from that room. Those beat every default in this article.
How the calculator works
The calculator has three formulas and two rows.
Framework
The seat-first event budget
- Seats you need in the room ÷ expected show rate = registrations you need. Do this for free and VIP seats separately.
- Registrations × cost per registration = ad budget per tier. Use cost per sale for VIP tickets.
- VIP sales × (price − fees − refunds) − VIP ad spend = VIP net contribution. Our target is zero or better.
- Total net cost ÷ people in seats = cost per checked-in attendee. This is the number you judge the campaign on.
Victory's operating model for budgeting paid traffic to live events.
The inputs are the seat target, the free and VIP split, a show rate for each tier, a cost per free registration, a cost per VIP sale, the VIP price, and fees and refunds as a percentage.
The outputs are registrations per tier, ad budget per tier, the VIP tier's net contribution and the cost per checked-in attendee.
One rule on inputs: count registrations from your ticketing system, not the ad platform. LinkedIn, for example, counts an Event Registration when a member registers within 30 days of clicking or seeing your ad.[2] Ad-reported cost per registration can flatter you.
Calculator
Event budget calculator
Start from the seats. Free and VIP tickets show up at different rates, so each tier gets its own registrations and budget.
Example inputs. Replace with your numbers.
Net cost per seated attendee
$43.66
$8,731 net cost for 200 people in seats
- Registrations needed450 free + 23 VIP sales
- 473
- Ad budget$9,450 free + $3,450 VIP
- $12,900
- VIP revenue, netAfter 8% fees and refunds
- $4,169
- VIP self-liquidationVIP tier pays for its own ads
- 121%
- Free registrations per seat
- 2.5
Count registrations from your ticketing system, not the ad platform.
How this is calculated
- Free seats = target attendees × (1 − VIP share); VIP seats = target attendees × VIP share
- Free registrations = free seats ÷ free show rate; VIP sales = VIP seats ÷ VIP show rate (both rounded up)
- Ad budget = free registrations × cost per free registration + VIP sales × cost per VIP sale
- VIP revenue, net = VIP sales × VIP price × (1 − fees and refunds)
- Net cost per seated attendee = (ad budget − VIP revenue, net) ÷ target attendees
- VIP self-liquidation = VIP revenue, net ÷ VIP ad budget
Estimates for planning, not a promise of results. The example inputs are illustrations, not Victory client results.
Where the default numbers come from
If you have no history, these are the defaults we'd start with, and why.
| Input | Our default | Industry figure |
|---|---|---|
| Free one-day show rate | 35% to 45% (use 40%) | About 72% check-in, median no-show about 28%[1] |
| VIP ticket show rate ($100 to $297) | 85% to 90% (use 87%) | About 83% check-in, median no-show about 17%[1] |
| Cost per free in-person registration, Meta | $18 to $24 | $26.31 Education and Instruction; $14.59 Arts and Entertainment[3] |
| Registration page conversion, cold Meta | 22% to 30% of visitors | 21.5% average; 24.4% dynamic, 11.6% static flows[4] |
| VIP tier ad spend recovered | 100% or more | No industry benchmark |
Victory figures are operator estimates from the events we run, not a dataset. Industry figures are from the sources cited.
Two caveats sit under that table.
The LocaliQ cost per lead is for leads-objective campaigns, which often use instant forms rather than a landing page.[3] Event registrations on a landing page usually cost a little more. Treat it as a starting guess.
The PheedLoop free median is far above ours.[1] We read it as mostly warm audiences: people who already know the host. Cold paid-social registrants are strangers who clicked an ad. They show at lower rates, which is why the calculator defaults to your history first and our range second.
Median check-in at free live events across 1,070+ events. On cold paid traffic, we plan on 35% to 45%: 2.2 to 2.9 registrations per seat instead of about 1.4.
Why your own history beats any default
Show rate isn't one number. It moves with format, room size and audience.
Clutch Events tracked 191 free executive B2B events across 13,155 registrations. Attendance ran from 86% at VIP and sport events down to 19% at vendor-owned conferences.[5] Same price (free), a 67-point spread.
Room size moves it too. In PheedLoop's data, free events of 10 to 49 expected attendees had a median no-show of about 37%, against about 24% at free events of 500 or more. Paid events stayed at roughly 15% to 18% no-show at every size.[1] Small free rooms need more registrations per seat. Paid rooms don't.
Common advice ignores all of this. Eventbrite's tip for free events is about 150 names on the list for 100 places.[6] That's a 1.5:1 ratio, which assumes about 67% of registrants show. On cold traffic, we plan on 2.2 to 2.9:1. The "3x rule" you hear in events circles is the honest version of the same math when show rate is closer to 35%.
Worked example (illustration, not a client result)
Say you need 200 people in a room: 180 on free tickets and 20 in VIP seats. Every figure below is hypothetical, picked from the middle of the ranges above.
| Line | Free tickets | VIP tickets ($197) |
|---|---|---|
| Seats to fill | 180 | 20 |
| Show rate | 40% | 87% |
| Registrations or sales needed | 450 | 23 |
| Cost per registration or sale | $21 | $150 |
| Ad budget | $9,450 | $3,450 |
| Revenue, net of 8% fees and refunds | $0 | $4,169 |
| Net cost | $9,450 | −$719 (profit) |
Hypothetical inputs: $21 per free registration (middle of our $18 to $24 range), $150 per VIP sale, $197 VIP price, 8% lost to fees and refunds. Swap in your own.
Total ad spend is $12,900. VIP revenue brings the net cost to $8,731 for 200 people in seats, about $44 per checked-in attendee.
Now watch the show rate. At 35%, the free side needs 515 registrations and $10,815. At 45%, it needs 400 and $8,400. Plug in PheedLoop's 72% instead and you'd budget for 250 registrations and $5,250, about half of what a cold-traffic room needs. That's how events end up half full with the budget spent.
The cost per registration matters less than people think. Swap our $21 for LocaliQ's $26.31 and the free side rises to $11,840.[3] Painful, but not fatal. A wrong show rate is fatal.
Splitting free and VIP
The VIP row exists to fund itself. On the events we run, our house standard is that VIP ticket revenue, net of fees and refunds, recovers 100% or more of VIP ad spend. If that holds, you can scale the VIP side with confidence, because those buyers show up.
Don't expect the VIP price alone to raise attendance. Inside the same event, PheedLoop found paying guests attended only 2 to 4 percentage points more reliably than comped guests.[7] The VIP promise (reserved seats, extra access, a reason to arrive on time) does the work. We cover how to price and package it in our free vs paid ticket split.
The VIP group is also your warmest audience when the offer comes. How we sell from stage starts with who is sitting in the front rows.
A webinar mode, kept separate
The same math works for webinars, with different inputs. On cold-traffic single-date evening webinars with a two-day ad window, we typically see 25% to 35% of registrants attend live. Industry reports run higher, 40% at Goldcast and 47.7% at Livestorm, but they are mostly B2B and house-list registrants.[8][9]
Webinar registrations also cost far less. In our experience, a first cold-traffic test lands at $12 to $20 per registration before optimisation, against LocaliQ's $26.31 for education lead campaigns.[3] Our best ever, on a weekly evening webinar with ads running only in the two days before, is $4 to $5. Don't mix these numbers into an in-person budget.
What other calculators miss
The tools that rank for this term are cost aggregators. SwarmTix's, for example, takes expected attendees plus flat line items and treats marketing as a 10% to 15% rule of thumb.[10] It assumes the attendees exist.
The closest thing to a demand tool is Ticket Fairy's marketing budget calculator. It works from revenue and ticket acquisition cost, and labels its own benchmarks "directional".[11] It still doesn't start from seats or split show rates by ticket tier.
Mistakes we see
- Budgeting on registrations. A $21 registration that shows 40% of the time costs $52.50 per seat. Price the seat.
- Using platform show rates for cold traffic. Warm-audience medians cut your registration target roughly in half.
- Repeating untraced numbers. Eventbrite's "about 50% free, 70% to 90% paid" is described as a ballpark with no sample.[12] The "40% to 60% no-show at free events" range traces only to other roundups.[13] Cvent's "31.6% of marketing budgets go to events" carries no source.[14]
- Stretching a free event to three days. In our experience, free three-day events show 10% to 15% of unique registrants, against 35% to 45% for one day. Our one-day vs multi-day post-mortem explains why.
- Hoping instead of using history. The best default is the last event you ran.
For the full system around the budget (reminders, confirmation pages, ticket tiers and the sale), start with our event marketing guide, and compare your numbers against the 2026 event statistics. If you want us to check your inputs before you spend, book a strategy call.
Frequently asked questions
Sources
- 1.Event Data Lab #05: no-show rates by ticket type and event size. PheedLoop, 2026-04-29.
- 2.Event Registrations metric definition. LinkedIn Help, current, checked 2026-10-04.
- 3.Facebook advertising benchmarks. LocaliQ / WordStream, 2026-09-23.
- 4.Event Program Benchmarks 2026. Bizzabo, 2026-03-05.
- 5.State of Executive B2B Event Attendance. Clutch Events, 2026 (covers Feb 2025 to Mar 2026).
- 6.Top tips for organisers running free events. Eventbrite (AU blog), undated, checked 2026-10-04.
- 7.Event Data Lab #06: registration completion and paying vs non-paying guests (with addendum). PheedLoop, 2026-05-26, addendum 2026-09-01.
- 8.2026 B2B Webinar Benchmark Report. Goldcast, 2026.
- 9.2026 Webinar Benchmark Report. Livestorm, 2026-09-01.
- 10.Event budget calculator. SwarmTix, current, checked 2026.
- 11.Event marketing budget calculator. Ticket Fairy, 2026-04.
- 12.How to increase event attendance. Eventbrite, 2024-10-23.
- 13.How to prevent no-shows at your events. Eventtia, 2025-08-18.
- 14.Trade show budget. Cvent blog, 2025.
Written by
Ray GillespieCo-Founder & COO
Ray runs day-to-day operations across every Victory engagement, building the systems, automations and AI-powered workflows that hold the machine together. He has overseen operations behind more than $120M in revenue.
Part of the guide: Event Marketing for Coaches and Experts: Fill the Room, Raise Show Rates and Monetize Free Events