Session Recordings and Heatmaps: How to Use Microsoft Clarity to Find Funnel Leaks
A funnel-first way to read Microsoft Clarity: start at the biggest drop, split by traffic source, watch four signals, and fix in order of cost.
 Ray GillespieCo-Founder & COO
Published 8 min read
On this page
Key takeaways
- Start from the funnel drop, not from random recordings. Build a Clarity funnel, find the step with the biggest drop, and watch only that step's sessions first.[1]
- Four signals do most of the work: rage clicks, dead clicks, quick backs and excessive scrolling. Each points to a different fix.[2]
- Split recordings by traffic source and device. Cold social visitors and email visitors behave like different audiences on the same page.
- Clarity can't see inside third-party iframes, and recordings are kept 30 days.[3] Embedded calendars and order forms are blind spots.
- Without consent, Clarity counts every page view as a new session, so a multi-step funnel looks like a total leak.[4] Check consent before you trust the funnel.
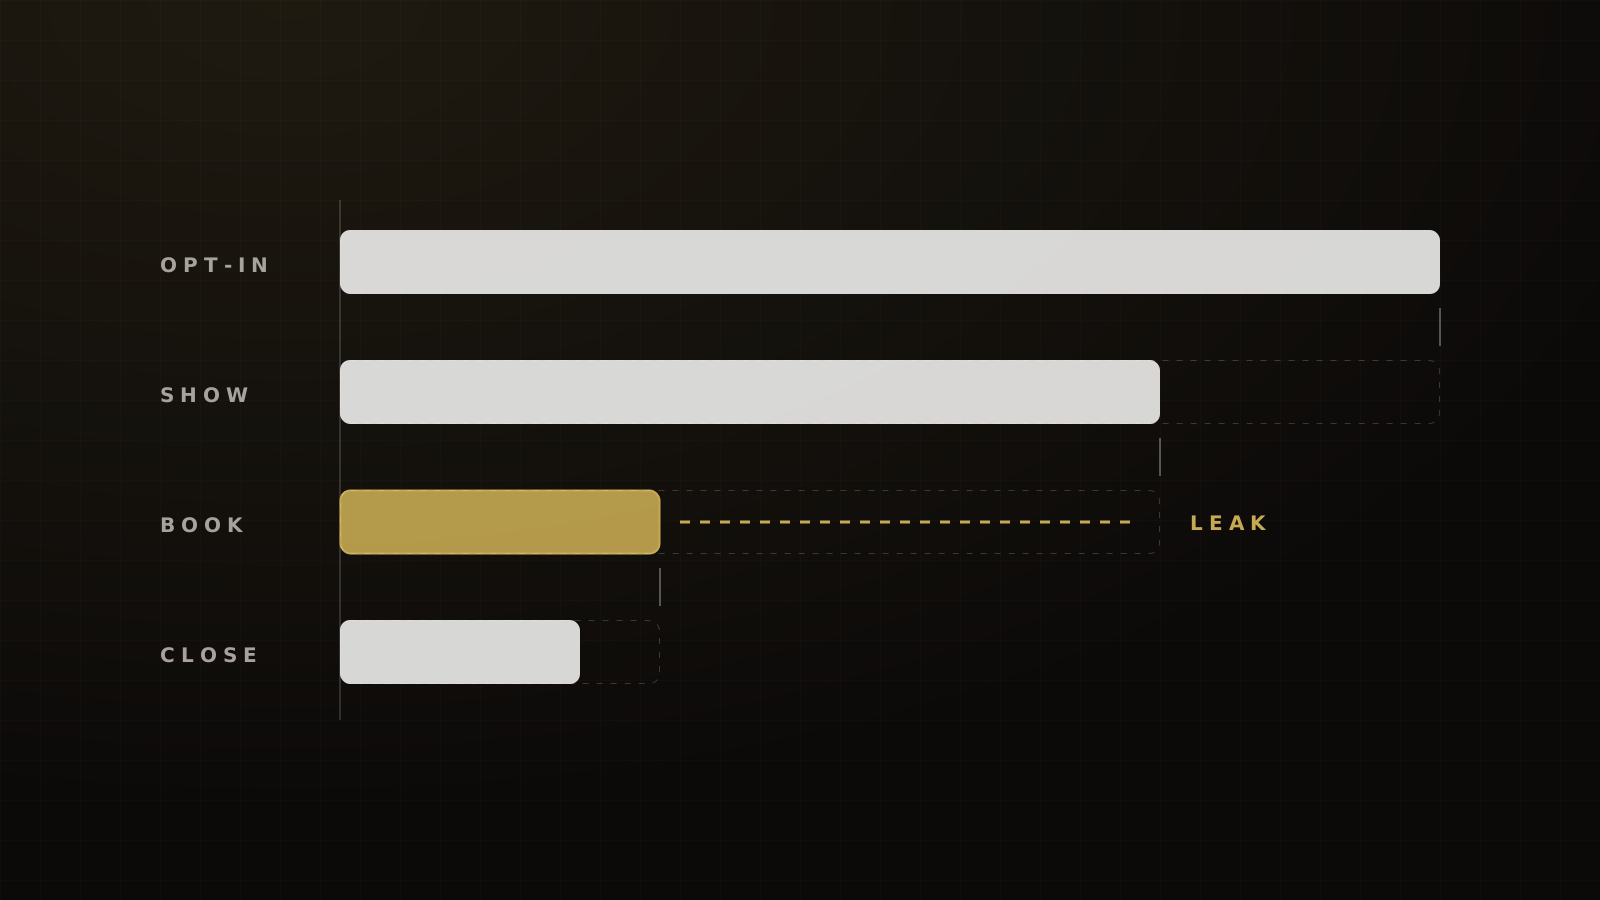
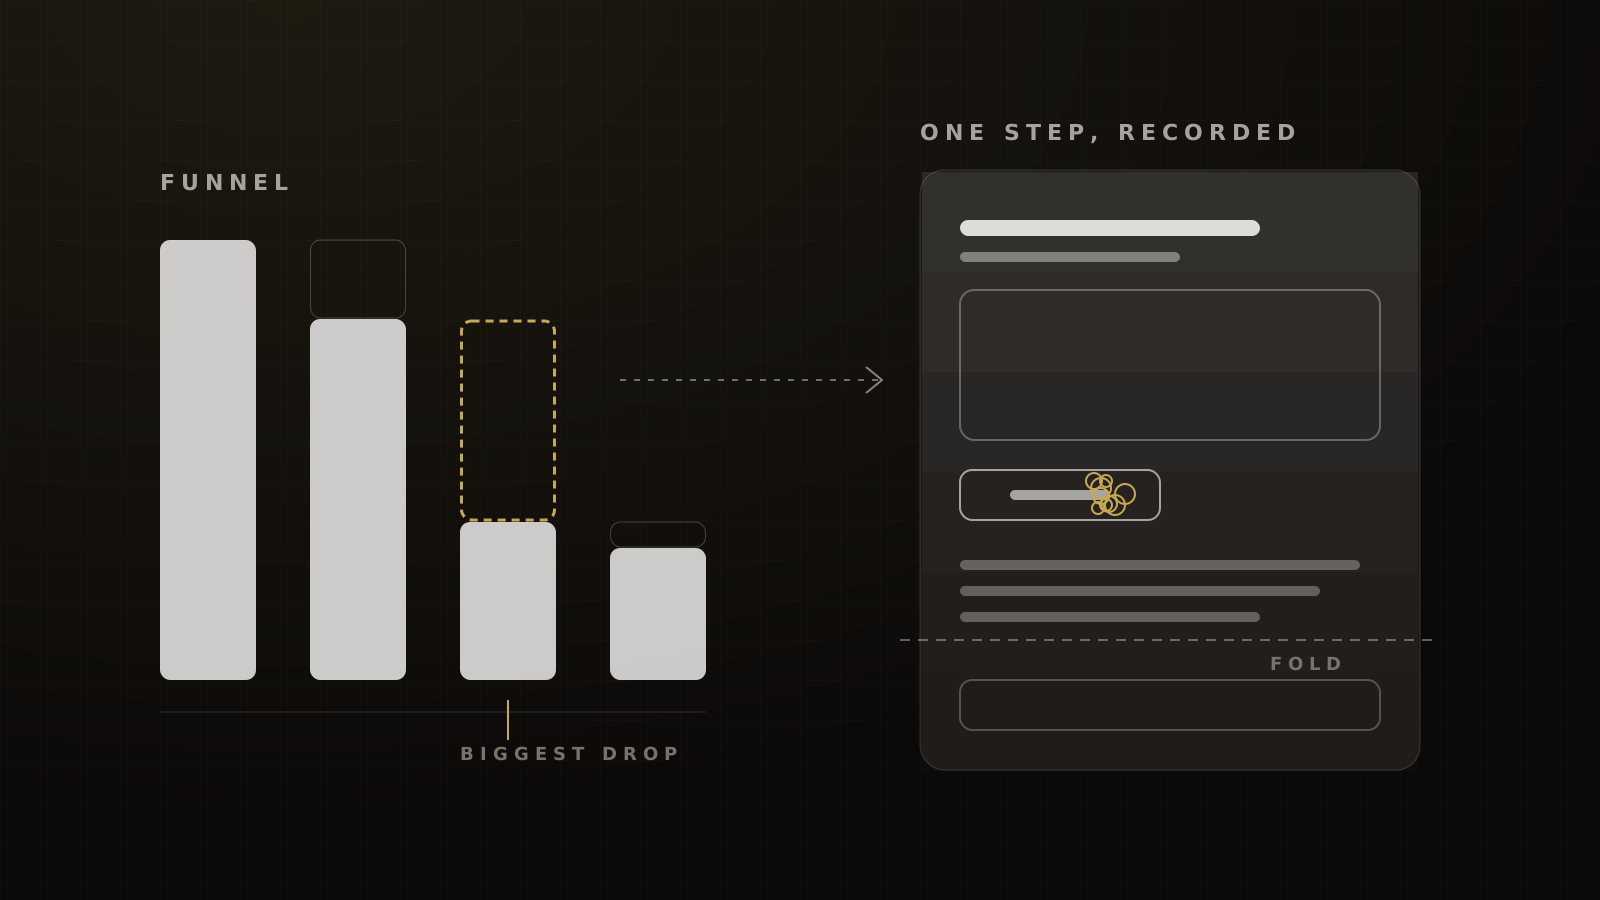
Install Microsoft Clarity on every funnel page, then start where the money leaks. Build a funnel for your steps, find the step with the biggest drop, and watch that step's recordings, split by traffic source and device. Fix what you see there first, re-measure, and only then scale traffic.
Most guides tour Clarity's features. This is the order we'd read it in on a coaching, course or event funnel.
The short answer: start from the funnel drop, not from random recordings
Random recordings are a time sink. You'll watch session after session of people reading happily and miss the one step where most of them leave.
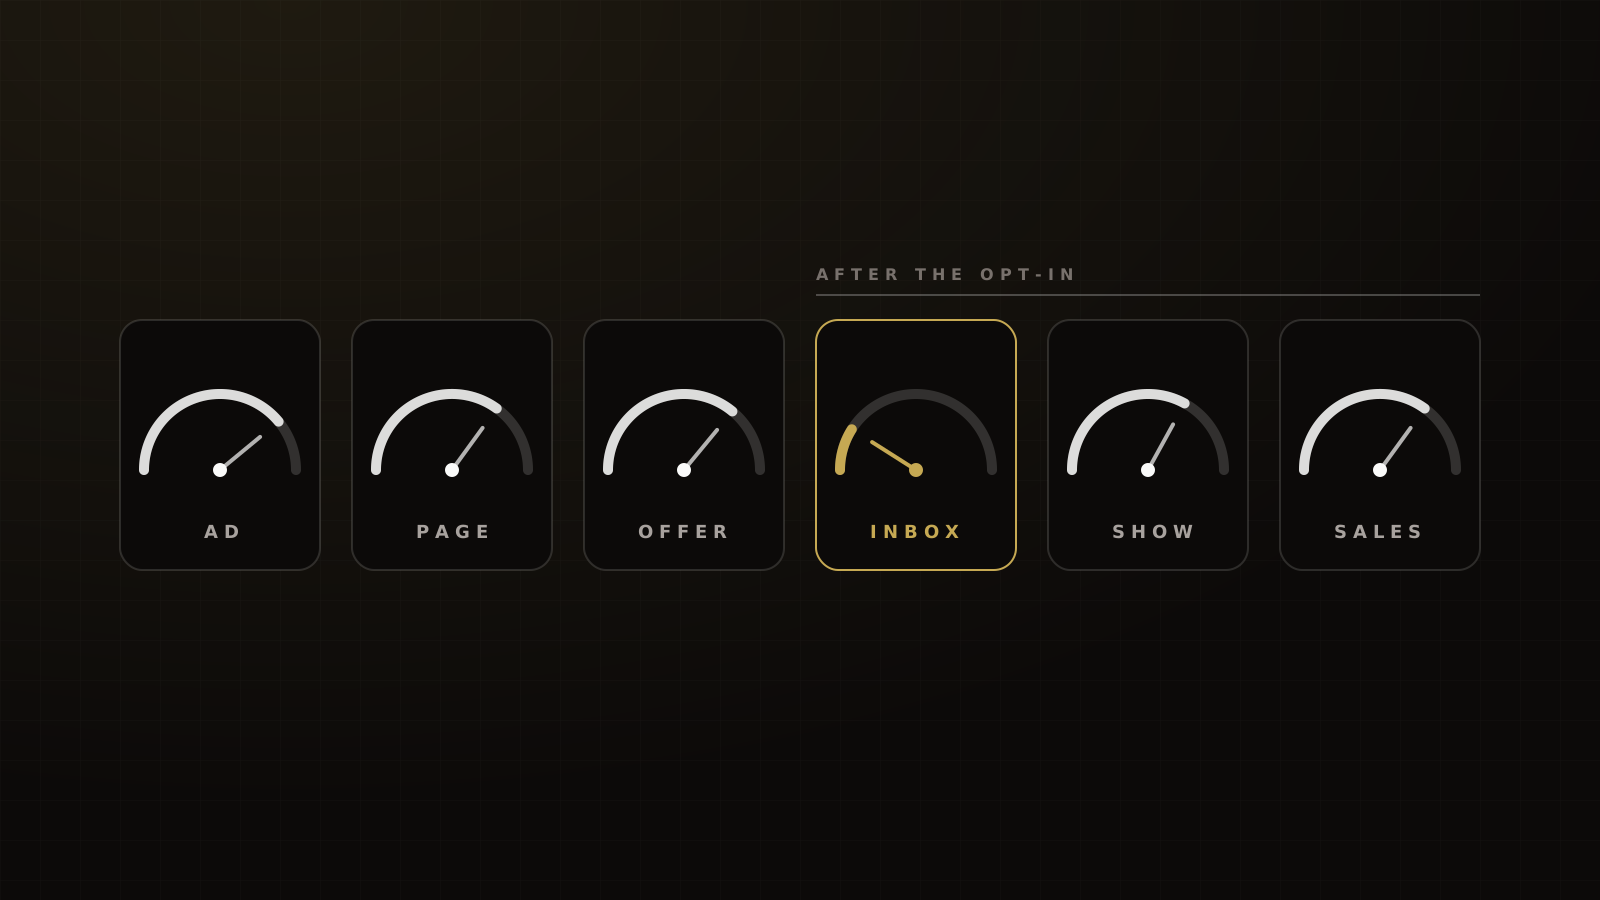
Hormozi's More, Better, New is the right frame: before you do more (more traffic) or new (new pages), find the constraint, the step with the biggest drop, and make it better. Clarity's job is to show you why people drop at that step.
Recordings also tell you whether the problem is the page or the offer. In Brunson's hook, story, offer terms: if people read the whole page and still leave at the price, the story worked and the offer didn't. If they leave before the story starts, it's the hook.
Set up Clarity for a funnel
- Tag every step. Put the Clarity script on the opt-in page, the confirmation page, the sales page, the checkout and the booking page. A funnel you can't see end to end can't be diagnosed.
- Create smart events for each conversion. Clarity's smart events can be button clicks, page visits or API events, with no code.[5] Make one for the opt-in, the ticket or order, and the booked call.
- Build the funnel. Clarity funnels are ordered steps, built from smart events or page visits. Each step shows the share and count of sessions that progressed or dropped, linked to the recordings and heatmaps behind it.[1]
- Mask inputs. Keep form fields masked so names, emails and phone numbers never appear in recordings.
- Set up consent before you read anything. More on why below.
Two caveats change how you read a funnel. Clarity can't render third-party iframes, so an embedded booking calendar, order form or registration widget is a blank box. And recordings are kept for 30 days, with favorites and a random sample kept up to 9 months.[3] Measure iframe steps another way, and favorite the sessions you want to keep.
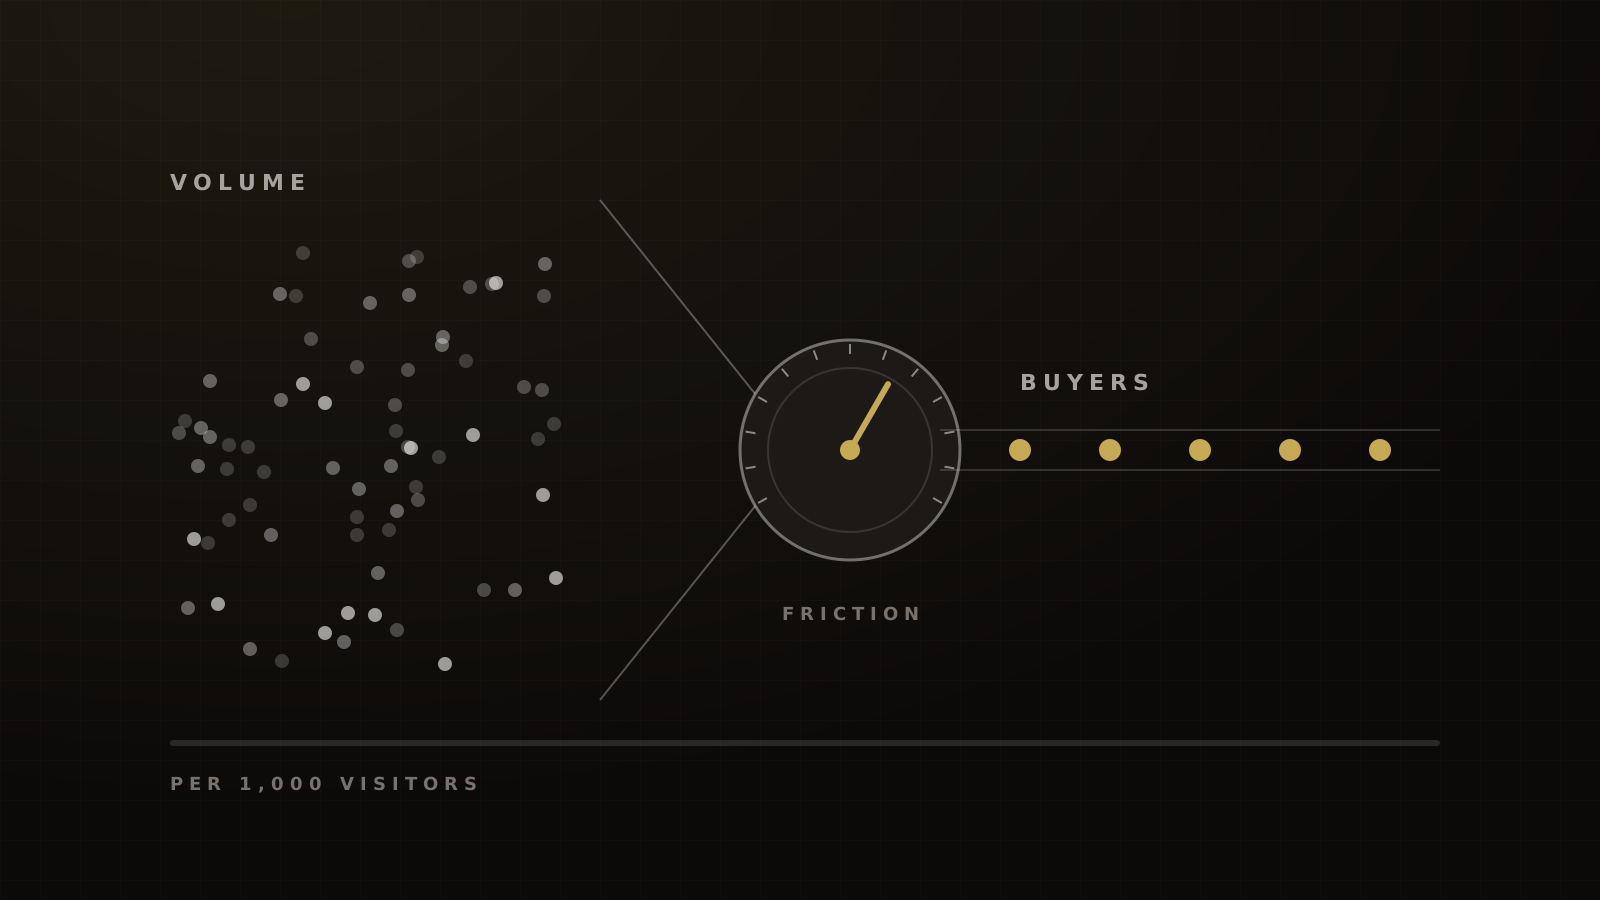
Volume isn't a constraint for most funnels. Clarity is free with no traffic limits or sampling, each heatmap caps at 100,000 page views, and a project records up to 100,000 sessions a day.[3] There's no minimum traffic to generate a heatmap.[6]
The consent trap
This is the warning we haven't seen in other Clarity guides. For visitors from the EEA, the UK and Switzerland, Clarity has enforced consent signals since 31 October 2025, and sets no cookies there without valid consent.[7]
Without consent, Clarity counts every page view as a new session. Pages per session reads as 1, quick backs read as 0, and a multi-step funnel shows a full drop-off at every page-view step.[4] If your funnel suddenly looks like nobody gets past step one, check consent before you rebuild the page.
The four signals and what each usually means on a funnel page
Clarity defines its behaviour signals precisely.[2] Here is what each one usually means on a funnel page, in our reading.
| Signal | Clarity's definition | Usually means on a funnel page |
|---|---|---|
| Rage clicks | Several rapid clicks in one small area | A button that looks live and isn't, a broken date or time picker, a slow-loading form |
| Dead clicks | A click with no visual change or navigation | Headshots, images or headlines people expect to be links |
| Quick backs | Leaves and returns within a short time | Looking for missing information: the price, the time, the venue, the speaker |
| Excessive scrolling | Scrolling far more than reading | Can't find the form or the next step |
Definitions from Clarity's documentation. The 'usually means' column is our reading of funnel pages, not a measured study.
Friction is common, so don't panic at the first rage click. Contentsquare's 2026 benchmark found 35.2% of sessions hit at least one friction signal, across 99 billion sessions on 6,500 sites.[8] It also found that cutting a page's rage clicks by 1.5 points was associated with one more page view per session. That's engagement, not conversion.
Mobile is where dead clicks pile up. Fullstory counted 929 dead clicks per 1,000 mobile sessions in 2024.[9] That's a rate of events, not a share of sessions, but it tells you where to look first.
Rage clicks and quick backs on mobile often point to a slow page rather than a bad one. When we rebuild landing pages in v0 and Vercel, our standard is that they pass all three Core Web Vitals "good" thresholds on mobile, with the largest element loading in under two seconds.
Read the scroll and click maps
Clarity offers click, scroll, area, conversion and attention maps.[6] On a funnel page, two of them answer most questions.
The scroll map: where does the CTA sit against where people stop? If the opt-in form or the first button sits below the point most visitors reach, the page isn't failing to persuade. People never see the ask.
Attention is front-loaded. In Nielsen Norman Group's 2018 eyetracking study, people spent about 57% of their viewing time above the fold and 74% in the first two screens.[10] That's desktop data and eight years old, but the shape holds. The often-quoted "80% above the fold" figure comes from the 2010 version of the study.
The click map: what do people try to click? Clicks on speaker headshots, testimonial images or a date are requests. Make them work: link the headshot to the bio, the date to the calendar.
Read mobile maps first. 83% of landing-page visits in Unbounce's 2024 dataset were on mobile, and desktop converted 8% better.[11] The mobile page is the one most of your traffic sees.
Split by traffic source and device
Clarity filters by utm_source, utm_medium, campaign, channel and referrer.[12] Use them. The same page can "work" for one audience and "fail" for another.
Unbounce's education pages converted at 14.1% from email and 5.1% from paid social.[13] On the funnels we run, cold Meta traffic to a generic opt-in page converts 15% to 22%, and a warm email or SMS list to a registration page converts 25% to 35%. Blend those and you get an average that describes nobody.
So filter the biggest-drop step by source, then by device. Cold mobile visitors from Meta are usually the group to watch first: they're the most traffic and the least patience.
The fix-priority rule
You'll find more problems than you can fix this week. Rank them:
Framework
The Clarity fix-priority rule
- Stage drop-off. How many sessions does this step lose? Bigger drops first.
- Share of sessions affected. Of the sessions at that step, what share shows the signal? Filter by the signal to count them.
- Ease. A broken link is a quick fix. A rewritten offer takes days.
- Score each finding as drop-off × share affected, then break ties on ease.
- Fix one thing, re-measure, then test. Give the fix 7 days at normal spend, or about 50 conversions, before you judge it.
Victory's method for ranking Clarity findings. The constraint-first idea is credited to Alex Hormozi's More, Better, New.
A labelled illustration: a sales page loses 60% of sessions, and 30% of the sessions there show rage clicks on a fake button. A confirmation page loses 20%, and 50% of its sessions show quick backs. Scores of 18 and 10: fix the sales page button first. The numbers are made up to show the method.
Once the obvious friction is gone, move from fixing to testing. Our guide to A/B testing low-traffic funnels covers what to test first and when to call it.
Expect modest, honest results. Clarity's own case study describes a site that found clickable-looking blog titles with no links in its click maps. After a new navigation path, blog conversions rose 10%, alongside other changes.[14] It's a vendor case with several changes at once, and we haven't found a defensible cross-site figure for what fixing rage clicks does to conversion.
Privacy and consent
Want the AI-assisted version?
This article covers the manual method. Clarity also has an MCP server that lets an AI client such as Claude query your Clarity data in plain language, within 10 requests per project per day and 3 days of data per request.[18] After a Clarity and Claude fix pass, our target is that only 25% to 30% of sessions on the fixed step show any friction signal, against Contentsquare's 35.2% average.[8] The workflow lives in our AI marketing operations guide.
For where Clarity fits in a full audit, see the funnel diagnostic and the stage benchmarks in our funnel CRO guide. For a worked example of a page rebuilt after this kind of review, read the event landing page case study. Want us to read yours? Book a strategy call.
Frequently asked questions
Sources
- 1.Funnels. Microsoft Learn (Clarity), living doc, checked 2026-10-04.
- 2.Semantic metrics (rage clicks, dead clicks, quick backs, excessive scrolling). Microsoft Learn (Clarity), living doc, checked 2026-10-04.
- 3.Clarity FAQ. Microsoft Learn (Clarity), living doc, checked 2026-10-04.
- 4.Clarity without cookie consent. Microsoft Learn (Clarity), living doc, checked 2026-10-04.
- 5.Smart events. Microsoft Learn (Clarity), living doc, checked 2026-10-04.
- 6.Heatmaps overview. Microsoft Learn (Clarity), living doc, checked 2026-10-04.
- 7.Consent management. Microsoft Learn (Clarity), living doc, checked 2026-10-04.
- 8.Digital Experience Benchmark: frustration. Contentsquare, 2026-04-01.
- 9.Consumer mobile frustration is rising, and it's costing brands. Fullstory, 2025-07-15.
- 10.Scrolling and attention. Nielsen Norman Group, 2018-04-15.
- 11.Conversion Benchmark Report. Unbounce, 2024-08-29.
- 12.Filters overview. Microsoft Learn (Clarity), living doc, checked 2026-10-04.
- 13.Education conversion rate benchmarks. Unbounce, 2024-11-05.
- 14.Switas case study. Microsoft Clarity, 2025-03.
- 15.US Court of Appeals reversal expands potential liability for companies using session replay. Duane Morris LLP, 2025-06-25.
- 16.Popa v. Microsoft Corp., No. 24-14. US Court of Appeals for the Ninth Circuit, 2025-08-26.
- 17.SB 690: invasion of privacy (bill status). CalMatters Digital Democracy, 2026-09-30.
- 18.Clarity MCP server. Microsoft Learn (Clarity), living doc, checked 2026-10-04.
Written by
Ray GillespieCo-Founder & COO
Ray runs day-to-day operations across every Victory engagement, building the systems, automations and AI-powered workflows that hold the machine together. He has overseen operations behind more than $120M in revenue.
Part of the guide: Funnel CRO: Benchmarks, Diagnostics and Tests for Coaching, Course and Event Funnels