Self-Liquidating Offers: How to Build a Funnel That Pays for Its Own Ads
A self-liquidating offer turns ad spend into buyers at break-even. The net-of-fees math, the ROAS target we hold, and why SLOs break when you scale spend.
 Ray GillespieCo-Founder & COO
Published 10 min read
On this page
Key takeaways
- A self-liquidating offer (SLO) is a low-priced product, usually under $100, sold to cold traffic so its revenue, bumps and upsells win back most or all of the ad spend.
- Count it net. Stripe keeps its fee when you refund and charges $15 per dispute, so a gross 1.0 ROAS is below break-even.[1]
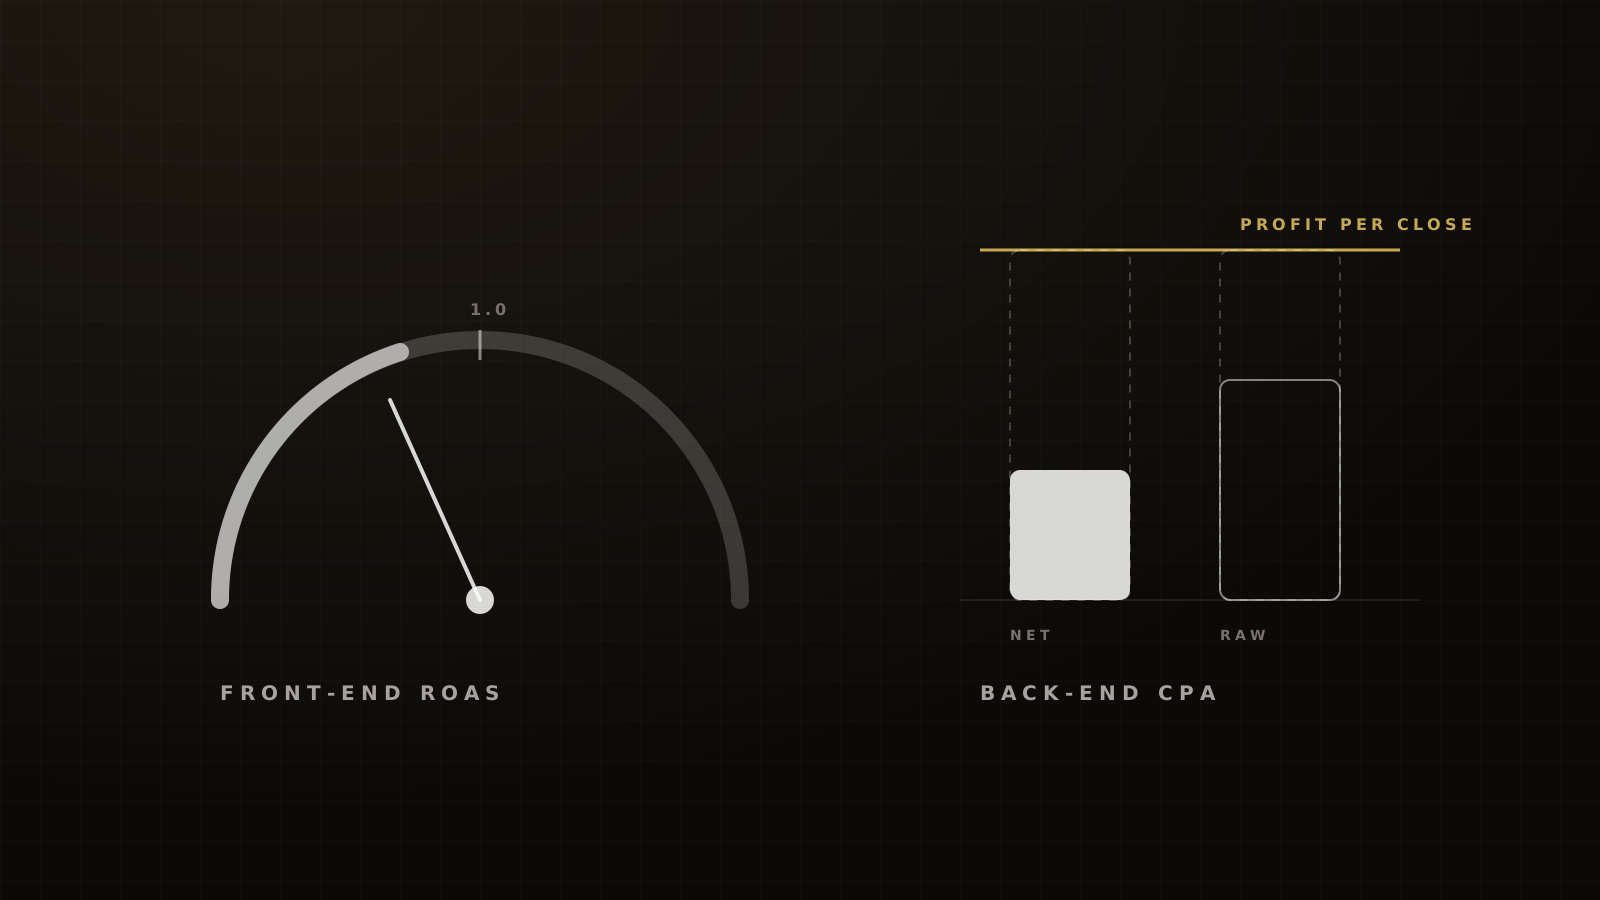
- The target we hold is 0.8–1.2 front-end ROAS at scale, judged on back-end CPA, not on front-end profit.
- Judge the cohort, not the week. High-ticket sales that closers make weeks later sit outside Meta's default 7-day click window.[2]
- What works at $300 a day can break at $3,000 a day. Returns diminish as spend rises.[3]
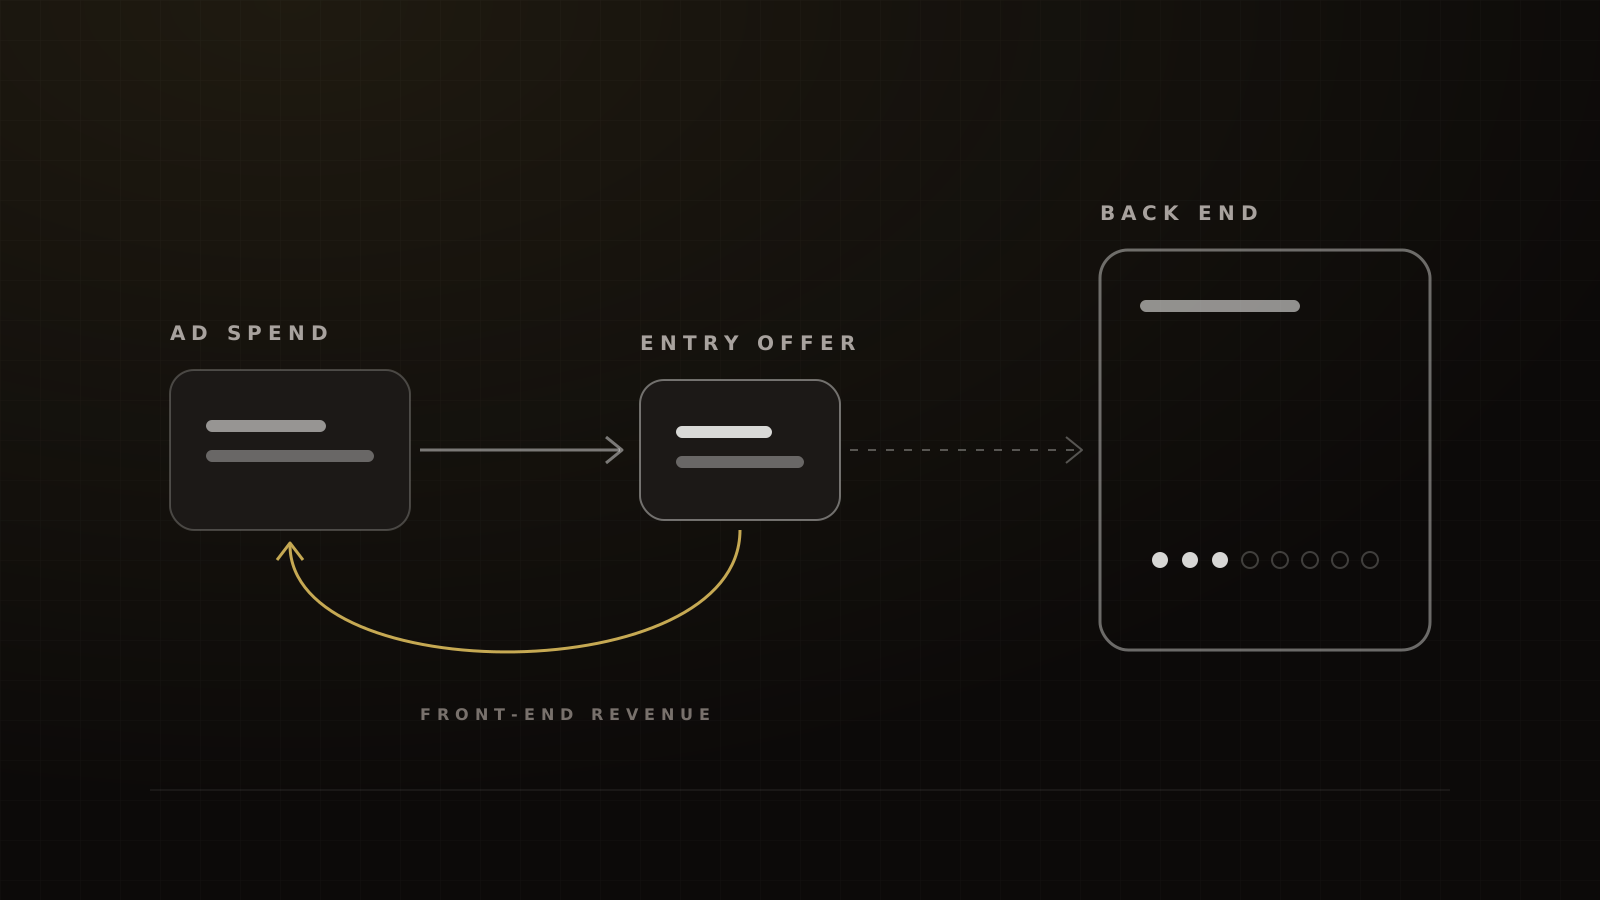
A self-liquidating offer is a low-priced product sold to cold traffic so that its revenue pays for the ads. The high-ticket sale happens later, from a list of buyers instead of a list of strangers.
"Self-liquidating" is a result you measure, not a template you install. Measure it net of processing fees, refunds and chargebacks. Then judge it twice: once on the front end, where the goal is roughly break-even, and once on the whole cohort, after your closers have worked it.
Here's the math vendor pages skip, the target we hold, and why these funnels break when you scale them.
What a self-liquidating offer is (and how it differs from a tripwire)
Russell Brunson popularised the self-liquidating offer: an opt-in, then a sales video or letter for a modestly priced product with an order bump, where the revenue covers the ad cost. The tripwire is its cheaper cousin. DigitalMarketer documented it, recapping Perry Belcher's 2014 case for low-risk tripwire offers,[4] and placed it second in its customer value sequence, after the lead magnet and before the core product.[5]
The difference is the job:
- A tripwire turns a prospect into a buyer. It can lose money and still do its job.
- An SLO recovers the cost of the traffic. If it doesn't, it isn't self-liquidating.
Plenty of SLOs work as tripwires too. The test is whether the front end pays for its own ads.
Why we don't run cold ads to a $3,000 offer
Cold traffic rarely buys a high-ticket offer on the first touch. Sending it straight to a call or an application means paying full price for attention and hoping a stranger trusts you with thousands of dollars.
And that attention costs more every year. Meta's average price per ad rose 9% in full-year 2025[6] and 12% year over year in Q2 2026.[7] A Facebook lead costs a median $27.66 across industries, according to WordStream and LocaliQ's 2025 benchmarks.[8] That's a lead, not a buyer, and certainly not a $3,000 client.
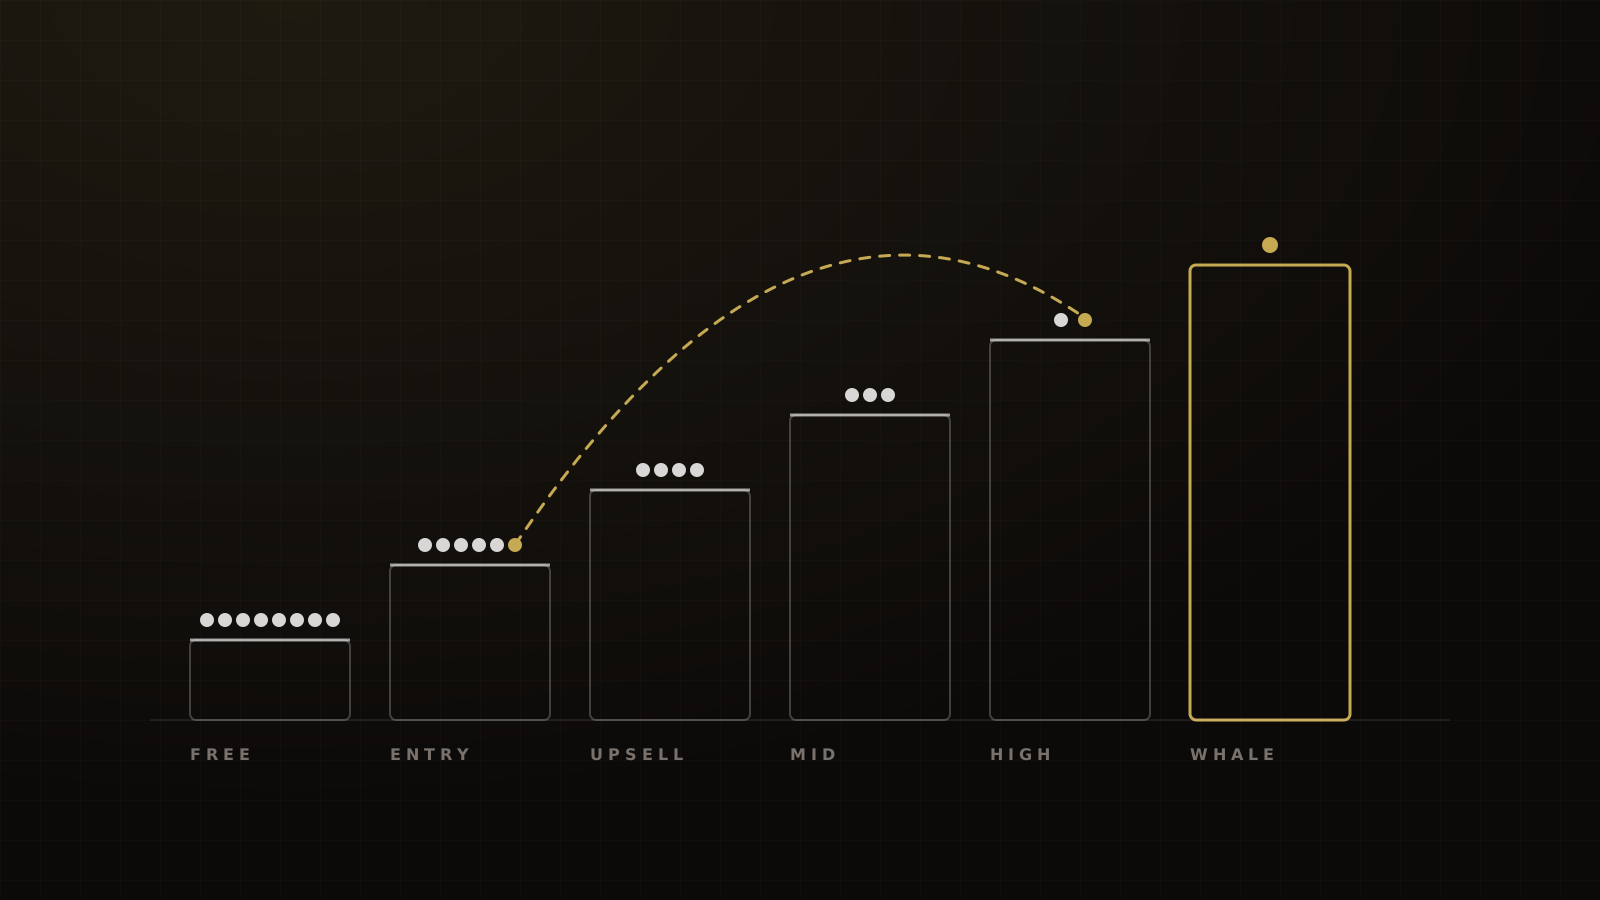
Devin's version: selling five figures on the first touch is whale hunting, and in the beginning we fish with dynamite. An SLO turns ad spend into buyers at roughly break-even, so the lead engine runs without stress. The high-ticket sale comes from nurture, to people who have already paid you once.
There's one exception worth naming. A well-run webinar can sell the high ticket directly. On a weekly evening webinar program we run, our best cost per lead is $4–5, with ads only in the 2 days before each session, and the program returns 4–7x ROAS week over week. A webinar sells the offer. An SLO buys the list. Many businesses need both.
The SLO math vendor pages skip
Gross ROAS vs net contribution
Every vendor page says the front end "pays for the ads". Almost none of them nets it.
Stripe's standard US rate is 2.9% + $0.30 per charge, plus 1.5% for international cards. It charges $15 per dispute and doesn't return the original fee when you refund.[1] PayPal's US card rate is 2.99% + $0.49, and PayPal Checkout is 3.49% + $0.49.[9] On a $27 product the fixed fee alone is more than a dollar.
Chargebacks add up on cheap, impulse-bought products. Chargebacks911's 2026 merchant survey puts the "industry average" at 0.57% of transactions, with 25.4% of merchants at 0.9% or higher.[10] Sift's network average rose from 0.17% in Q1 2025 to 0.26% in Q3 2025.[11]
The card networks watch the ratio. Visa's VAMP program divides fraud reports plus disputes by settled card-not-present transactions, and its US excessive-merchant threshold fell to 150 basis points on April 1, 2026, for merchants with 1,500 or more a month.[12] Braintree publishes Mastercard's excessive-chargeback level as 100–299 chargebacks and a 1.5–2.99% ratio, with both conditions required.[13] Confirm the current thresholds with your acquirer. Our own target is a dispute ratio under 0.5%.
| Line | Amount |
|---|---|
| Ad spend (1,000 visitors at a $2.50 click) | $2,500 |
| 40 buyers at $37 (a 4% purchase rate) | $1,480 |
| Bump at $27, taken by 12 buyers | $324 |
| One-click upsell at $197, taken by 4 buyers | $788 |
| Gross revenue (gross ROAS 1.04) | $2,592 |
| Processing fees on 44 charges | −$88 |
| Refunds at an assumed 8% | −$207 |
| Net revenue (net ROAS 0.92) | $2,297 |
| Out of pocket | $203, about $5 per buyer |
Hypothetical numbers throughout. Fees at Stripe's 2.9% + $0.30; the bump rides the front-end charge, the upsell is charged separately. The 8% refund assumption is invented for the example.
The dashboard says 1.04. The bank says 0.92. That gap is why "1.0 ROAS means break-even" is wrong. It's also why this funnel is still working: 40 people became customers for about $5 each.
Bumps and upsells: use your own take rates
The bump and the upsell are what make the math close, and the public numbers on them are messy.
SamCart's March 2026 guide says bumps convert 30–40%.[14] Its April 2026 page says 35–40%, and that one one-click upsell lifts average order value by 68%.[15] That 68% is order-value lift, not the share of buyers who take the upsell, and neither page shows its method. ThriveCart says upsells convert 4–10%, with no source given.[16] SamCart's own featured seller ran $47 + a $47 bump + a $497 upsell for $154 per customer, with a 56% bump and a 6.87% upsell.[15]
In our experience, the one-click upsell on a sub-$100 coaching front end takes 8–12%. Placement moves that number more than the product does. Rokt Aftersell's 2026 data from 17 million Shopify sessions found the same post-purchase offer converted 6.96% at its best placement and as low as 0.18% at its worst.[17]
Plan on the vendor numbers, then replace them with your own after the first hundred orders.
Break-even, not profit, is the target
The target we hold is a front-end ROAS of 0.8–1.2 at scale, judged on back-end CPA. There's no public benchmark for that range. It's our operating target, and it means the front end is allowed to lose a little money if the back end pays.
Ray's view is that hovering around 1.0 gives you a massive lead engine you're not stressed about, and that even 0.8 works when the leads are good and the data is clean. You're recycling money into buyers.
To get there, the page has to convert. On our funnels, cold traffic buys from a $7–$47 sales page at 3–6%. ClickFunnels estimates 3–5% for digital products under $50, and calls it an estimate.[18]
Even old public "proof" needs care. One frequently shared DigitalMarketer case reported $43,861.50 from a $27 offer against $10,795.01 of Facebook ads, but over different periods.[19] You can't compute a ROAS from numbers measured over different windows, and neither can the people who share it.
Judge the cohort, not the week
The front end is half the verdict. The other half is what the buyers do next. On Kajabi, 53.8% of all expert earnings came from a customer's second or later purchase.[20]
Ads Manager won't show you most of that. Meta's default attribution is 7-day click, 1-day engage-through and 1-day view, per a secondary write-up of Meta's 2026 change; confirm the setting in your own account.[2] A buyer who books a call in week two and closes in week four never shows up as an ad conversion.
So run Marius's back-end CPA:
Back-end CPA = (ad spend − net front-end revenue) ÷ high-ticket closes
Run it on pessimistic assumptions, by cohort, at 30, 60 and 90 days. If that number sits well under the gross profit of one high-ticket sale, the funnel works, even at a front-end ROAS below 1.0. The SLO calculator lays out every input.
The back-end steps need their own standards. Calls booked no more than about three days out show 82–88% for us, against an average B2B no-show rate of 15.9% in RevenueHero's 2025 data.[21] Our standard is a first dial on every new buyer in under an hour during staffed hours. InsideSales' 2014 audit found a median of 3 hours 8 minutes to first call among companies that called at all.[22]
Before raising spend, the target we hold is a 30-day cash multiple of at least 1.5x fully loaded acquisition cost. Hormozi's stated minimum for client-financed acquisition is 2x.
Why an SLO that works at $300 a day breaks at $3,000 a day
The first week at test spend is the best audience you'll ever buy. Scaling changes four things at once.
- Saturation. Google's Meridian documentation puts it plainly: as spend on a channel rises within a period, you eventually see diminishing marginal returns.[3] The tenth $300 buys less than the first.
- Auction pressure. Prices per ad are rising across the platform,[7] and bigger budgets reach further into audiences that cost more to convert.
- Frequency and creative fatigue. The same people see the same ad more often. A working cold ad runs 1.8–2.5% link CTR for us, against LocaliQ's 2026 average of 1.74% for Education & Instruction lead campaigns.[23] Watch for CTR sliding toward the average as frequency climbs.
- Buyer quality. Cheaper buyers at the margin ascend less. Front-end ROAS can hold while back-end CPA gets worse.
Our rule before scaling is a stress test: 7 days at the planned daily spend on a capped audience, or until the ad set reaches about 50 optimisation events. That mirrors Meta's own learning phase, which an ad set exits after about 50 results in the week after its last significant edit.[24] Then we raise budget in steps and re-read back-end CPA at each step, not just front-end ROAS.
What to sell as the front end
Courses alone are worn out at this price. A quiz, a calculator, an audit or a template gives a personal result and feels more like consulting than another video course. That makes a $20 or $27 offer an easy yes. Charge before the result, not after it.
Price by buyer. For consumers, keep it under $100, usually under $50. Business owners will pay more, up to about $1,000, when they can treat the purchase as an ROI decision. The rule underneath is the same: low enough to buy without a call. Our guide to low-ticket offer pricing goes deeper.
Building it
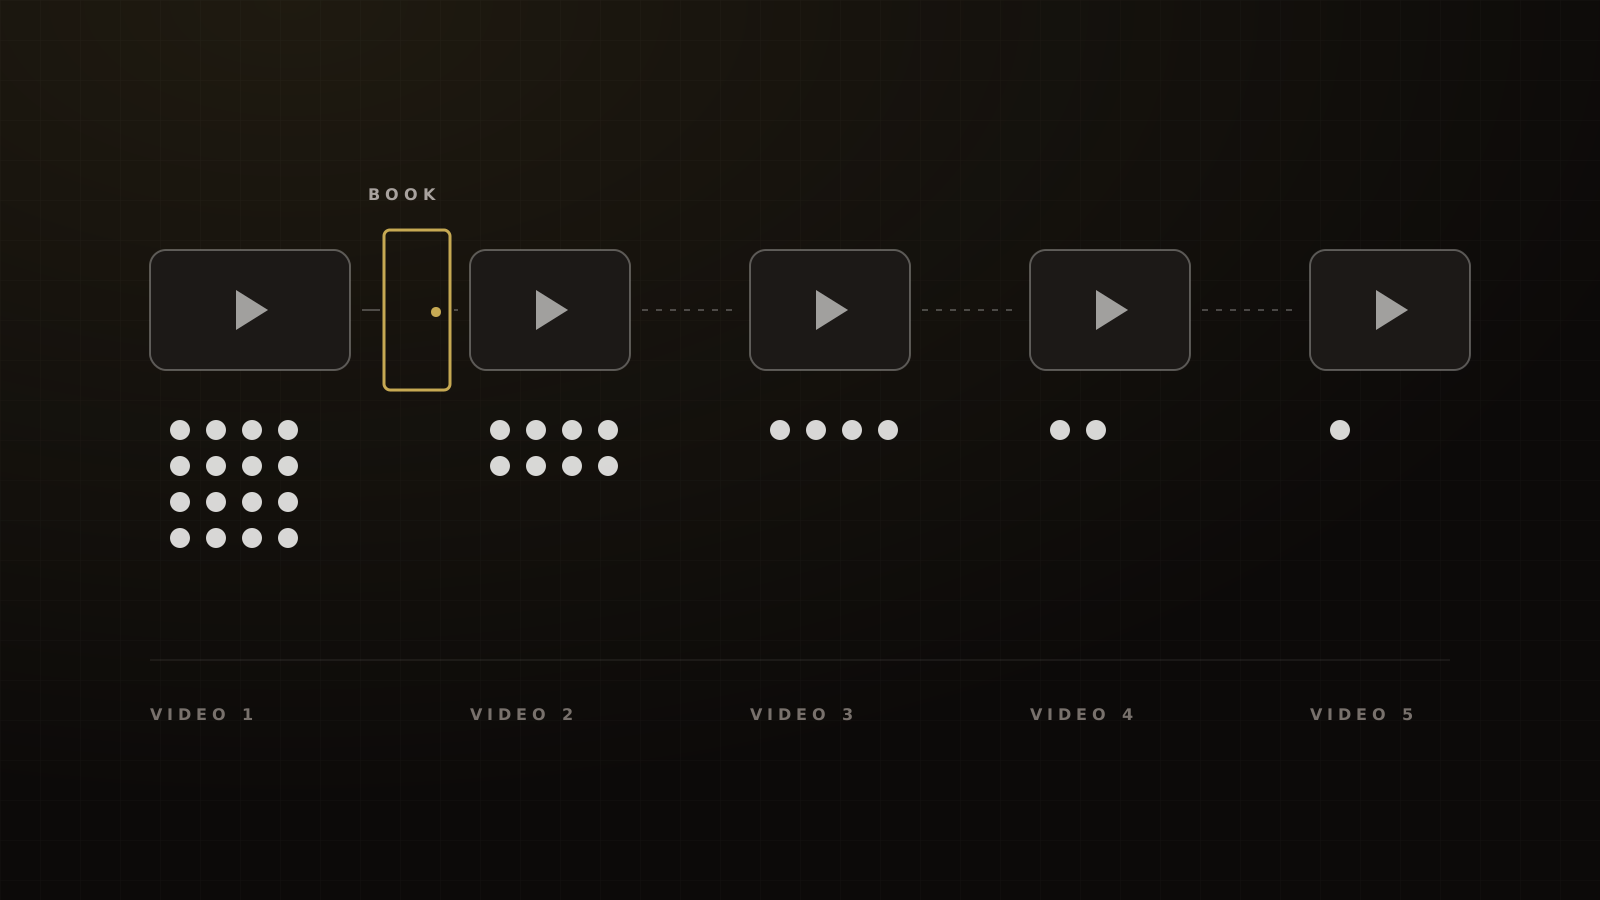
The build is short: a sales page, an order form with one bump, one one-click upsell, and a delivery page. Then a consumption gate before any booking link. In our experience, each video in a post-purchase training keeps about half the previous one's viewers, so the call to book goes after video one, not at the end of the series.
Buyers who don't qualify for the call get a downsell or a free community, not a closer's hour. The full ascension sequence, including the GoHighLevel build, is in our low-ticket funnel guide. The whole ladder this front end feeds is in our offer architecture pillar, and the traffic side is in paid ads for coaches.
If you have a $2,000+ offer and cold ads to a call are costing too much, we can pressure-test the front end on a strategy call.
Frequently asked questions
Sources
- 1.Pricing. Stripe, undated, checked 2026-10-04.
- 2.Meta attribution change 2026: what engage-through attribution is. Dataslayer (secondary, citing Meta), 2026-04-09.
- 3.Media saturation and lagging. Google (Meridian docs), 2026-07-08 (updated).
- 4.Shifts in digital marketing (Traffic & Conversion Summit 2014 recap). DigitalMarketer, 2014-01-24.
- 5.Customer value optimization. DigitalMarketer, 2019-09-06.
- 6.Meta reports fourth quarter and full year 2025 results. Meta Platforms, 2026-01-28.
- 7.Meta reports second quarter 2026 results. Meta Platforms, 2026-07-29.
- 8.Facebook Ads Benchmarks 2025. WordStream / LocaliQ, 2025-09.
- 9.PayPal business fees (US). PayPal, 2026-10-01.
- 10.2026 Chargeback Field Report. Chargebacks911, 2026-06-30.
- 11.Q4 2025 Digital Trust Index: disputes. Sift, 2025-Q4.
- 12.Visa Acquirer Monitoring Program fact sheet. Visa, 2025.
- 13.Mastercard Excessive Chargeback Program (as published by Braintree). Braintree (PayPal) developer docs, undated page, thresholds effective 2019-10.
- 14.The complete guide to order bumps. SamCart, 2026-03-30 (updated).
- 15.How to increase average order value. SamCart, 2026-04-02 (updated).
- 16.Upsell solutions for course creators. ThriveCart, 2026-07-28 (updated).
- 17.2026 High Trust Revenue Report. Rokt Aftersell, 2026.
- 18.Traffic but no sales: conversion estimates by offer type. ClickFunnels, 2026-09-17.
- 19.How a list-building challenge grew a list (case study). DigitalMarketer, 2017-11-07.
- 20.Is selling online courses profitable?. Kajabi, 2026-08-05.
- 21.Ways to reduce no-show rates in sales calls. RevenueHero, 2025-08-18, updated 2026-04-24.
- 22.Annual 2014 Lead Response Report. InsideSales.com (XANT), 2014.
- 23.Facebook advertising benchmarks for 2026. LocaliQ, 2026-09-23 (updated).
- 24.About the learning phase. Meta Business Help Center, living doc, read 2026-10-04.
- 25.Back up those earnings claims: other lessons from the FTC's labor task force work. Federal Trade Commission, 2026-06-16.
- 26.Business Opportunity Rule: notice of proposed rulemaking. Federal Trade Commission, 2025-01-13.
Written by
Ray GillespieCo-Founder & COO
Ray runs day-to-day operations across every Victory engagement, building the systems, automations and AI-powered workflows that hold the machine together. He has overseen operations behind more than $120M in revenue.
Part of the guide: Offer Architecture: Value Ladders, Grand Slam Offers and Self-Liquidating Front Ends