Offer Architecture: Value Ladders, Grand Slam Offers and Self-Liquidating Front Ends
How to build a value ladder where every rung pays: a self-liquidating front end, bumps and upsells, high ticket and a whale tier, with the math per rung.
 Devin AlexanderCo-Founder & CEO
Published 20 min read
On this page
- What a value ladder is (and why Hormozi calls it a grid)
- Why the ladder matters: most revenue comes after the first purchase
- The rungs, and the job of each
- Rung economics: the table nobody publishes
- Making the front end pay for the ads
- Price gaps, and how many offers to show
- Grand Slam Offers on every rung
- How to audit your ladder this week
Key takeaways
- A value ladder is a sequence of offers where every rung has a job. The front end pays for the ads, bumps and upsells add margin, and the top rungs pay for the business.
- Most of the money comes after the first sale. On Kajabi, 53.8% of all expert earnings came from a buyer's second or later purchase.[1]
- Design the ladder from the top down (what would your best buyer pay for?) and fund it from the bottom up (an entry offer that roughly breaks even on ads after fees and refunds).
- Buyers skip rungs. Draw a ladder, but measure revenue per lead across every offer, the way Hormozi's value grid does.
- The target we hold for a self-liquidating front end is 0.8–1.2 front-end ROAS, judged on back-end CPA rather than on its own profit.
- Keep the top price off the page. Whales get sold on a call.
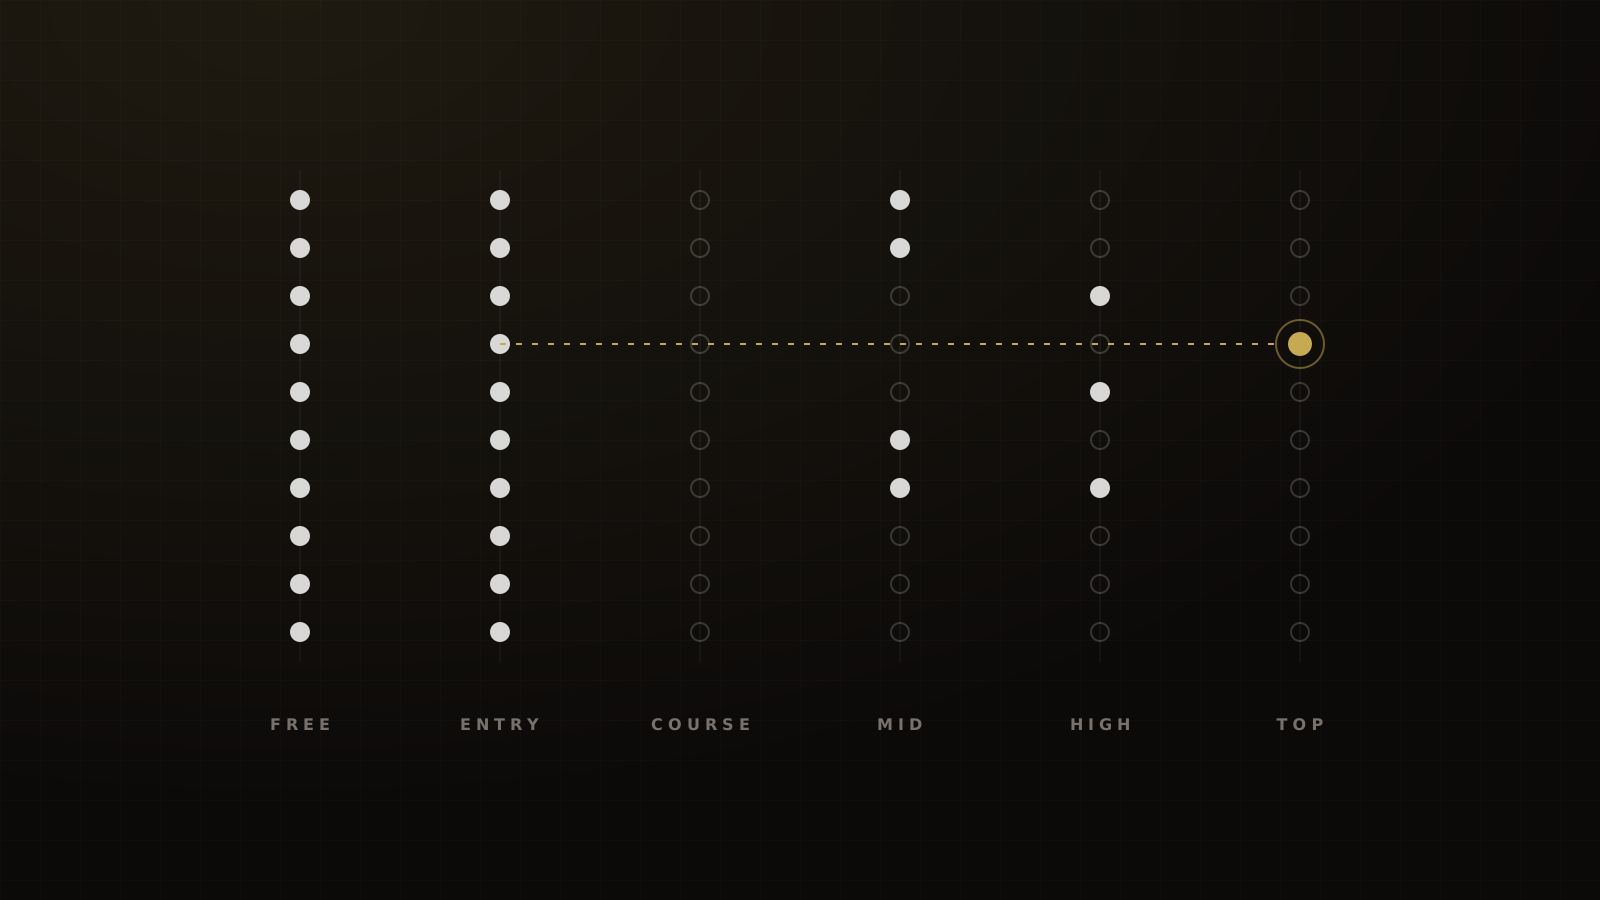
An offer ladder is a customer journey with a price on every step. Each rung solves the next problem the buyer has, and each one pays for something specific. The entry offer pays for the ads. Order bumps and upsells pay for the margin. The upper rungs, sold on a call or from a stage, pay for the business.
A pattern we see on strategy calls: the business has the top of the ladder or the bottom, rarely both. Some have a $5,000 program and run cold ads straight at it. Others have a $27 product that sells and nothing behind it. Either way, the buyers who would have gone further have nowhere to go.
This guide covers what each rung is for, the economics nobody puts on a value ladder diagram (fees, refunds, disputes, delivery cost, people time), how to make the front end pay for the ads, and the rung most businesses forget: the one for the whales.
What a value ladder is (and why Hormozi calls it a grid)
Brunson's ladder
Russell Brunson popularised the value ladder in DotCom Secrets. In our words: arrange your offers from a free or cheap entry point up to your most valuable, most expensive service, and make each rung good enough that the buyer wants the next one. A funnel, in his model, is the machinery that moves people up a rung. His example is a dentist who moves patients from a free cleaning to whitening, retainers and recurring visits.
ClickFunnels' own explainer breaks the ladder into five stages: bait, front end, middle, back end and peak.[2] That's useful vocabulary. What it doesn't give you is money: no fees, no refunds, no delivery cost, no data on how many buyers climb.
Hormozi's value grid
Alex Hormozi's correction, in $100M Money Models, is that buyers don't climb a neat staircase.[3] Some buy rung one and then rung four. Some walk in at rung three. So he maps offers as a grid of prospects against offers and adds up the revenue each prospect produces across all of them. His point is that the richer your back end, the more you can afford to pay for a lead than your competitors can.
Our synthesis: draw the ladder, measure the grid
We use both. Draw the ladder, because it forces you to name each rung's job and the problem it solves next. Then measure the grid, because that's where the money actually moves.
The scoreboard isn't "how many people bought rung two". It's revenue per lead across every offer, at 30, 60 and 90 days. ClickFunnels makes the revenue-per-lead case with a $249 vs $25 per-lead example, but its conversion rates are explicitly hypothetical.[4] The rest of this guide is about putting real numbers in.
Why the ladder matters: most revenue comes after the first purchase
In August 2026 Kajabi published platform data covering $11.7 billion across 101 million transactions since 2010. 53.8% of all expert earnings came from a customer's second or later purchase.[1]
Share of all expert earnings on Kajabi that came from a customer's second or later purchase
That's a share of dollars, not the chance any one buyer returns. It still says that more than half the money on a large course platform is ladder money.
The same data shows six-figure Kajabi experts averaging 2.67 purchases per buyer, against 1.22 for experts below six figures.[1] Experts with one offer typically earned $180 lifetime. Those with ten or more offers typically earned $82,212.[5] Kajabi says plainly that it can't separate cause from effect, because successful experts may add offers because they're successful. Read it as a pattern, not a promise.
Retail has the same one-and-done problem. Bluecore's 2025 benchmarks, built on 2024 data from more than 100 retailers, found that nearly three-quarters of customers buy only once, and that after a second purchase the likelihood of a third rises 95%.[6] That's retail, not coaching, so take the direction and leave the number.
Ray's phrase for this is that the first purchase "breaks the seal". Once someone has paid you anything, the next yes is a much smaller step than the first. That's why we would rather grow lifetime value from a base of buyers than keep paying to acquire strangers.
One honest limit. There is no public benchmark for how many low-ticket buyers go on to buy a $2,000+ offer. Not from Kajabi, not from ClickFunnels, not from anyone we could find. Every business has to measure its own, and the audit at the end of this guide shows how.
The rungs, and the job of each
| Rung | Typical price | Its job | Where it's sold |
|---|---|---|---|
| Free | $0 | Start the relationship and show who's interested | Ads, content, events, community |
| Entry (self-liquidating) | Under $100 | Turn ad spend into buyers at roughly break-even | Sales page and checkout |
| Bump and one-click upsell | Near the entry price, or one step above it | Lift order value at peak intent | The order form and the page after it |
| Mid ticket | $197 to $3,000 | Solve the next problem and deepen trust | Webinar, workshop, VIP ticket |
| High ticket | $5,000 to $10,000+ | Deliver the transformation and pay for the business | Sales call or stage |
| Whale | Off the page | Serve the few who want more | Conversation only |
| Continuity | Monthly | Keep the relationship paying | Beside any rung |
Price bands are typical ranges for coaching, course and event businesses, not rules. Your market sets the numbers.
The free rung: lead magnet, event or community
The free rung starts a relationship cheaply and tells you who's interested. A lead magnet, a free community, a free webinar or a free live event can all do the job.
Free events are our favourite version, because they sell. Run well (a short promotion window, a steady reminder cadence and a confirmation page with every detail), a free one-day in-person event shows 35–45% of registrants in our experience. Of the people who show up, 8–12% buy the main stage offer on the events we run. We haven't found a credible industry benchmark for that second number, so treat it as ours alone.
A free event also gives you a second rung inside the same room: a paid VIP ticket. Paid VIP tickets in the $100–$297 range show 85–90% for us. That lines up with PheedLoop's April 2026 data from more than 1,070 live events, where paid events had a median no-show of about 17%.[7] Our house standard is that VIP ticket revenue, net of fees and refunds, covers 100% or more of the VIP ad spend. There's no industry benchmark for that; it's the rule we hold. The full split is in our guide to free vs paid event tickets.
So the event version of the ladder runs free event, paid VIP, stage offer, mastermind. Each rung has its own job, and the VIPs in the front row are already buyers.
For webinars, we keep registration free and put a paid order bump right after sign-up. The person has already said yes, so the bump adds no friction to registration. In our experience that bump recovers about 40–50% of the webinar's ad spend. There's no public benchmark for a bump after a free registration. The nearest vendor figure, SamCart's 30–40% bump take rate, is measured on paid checkouts, a different denominator.[8]
The self-liquidating front end
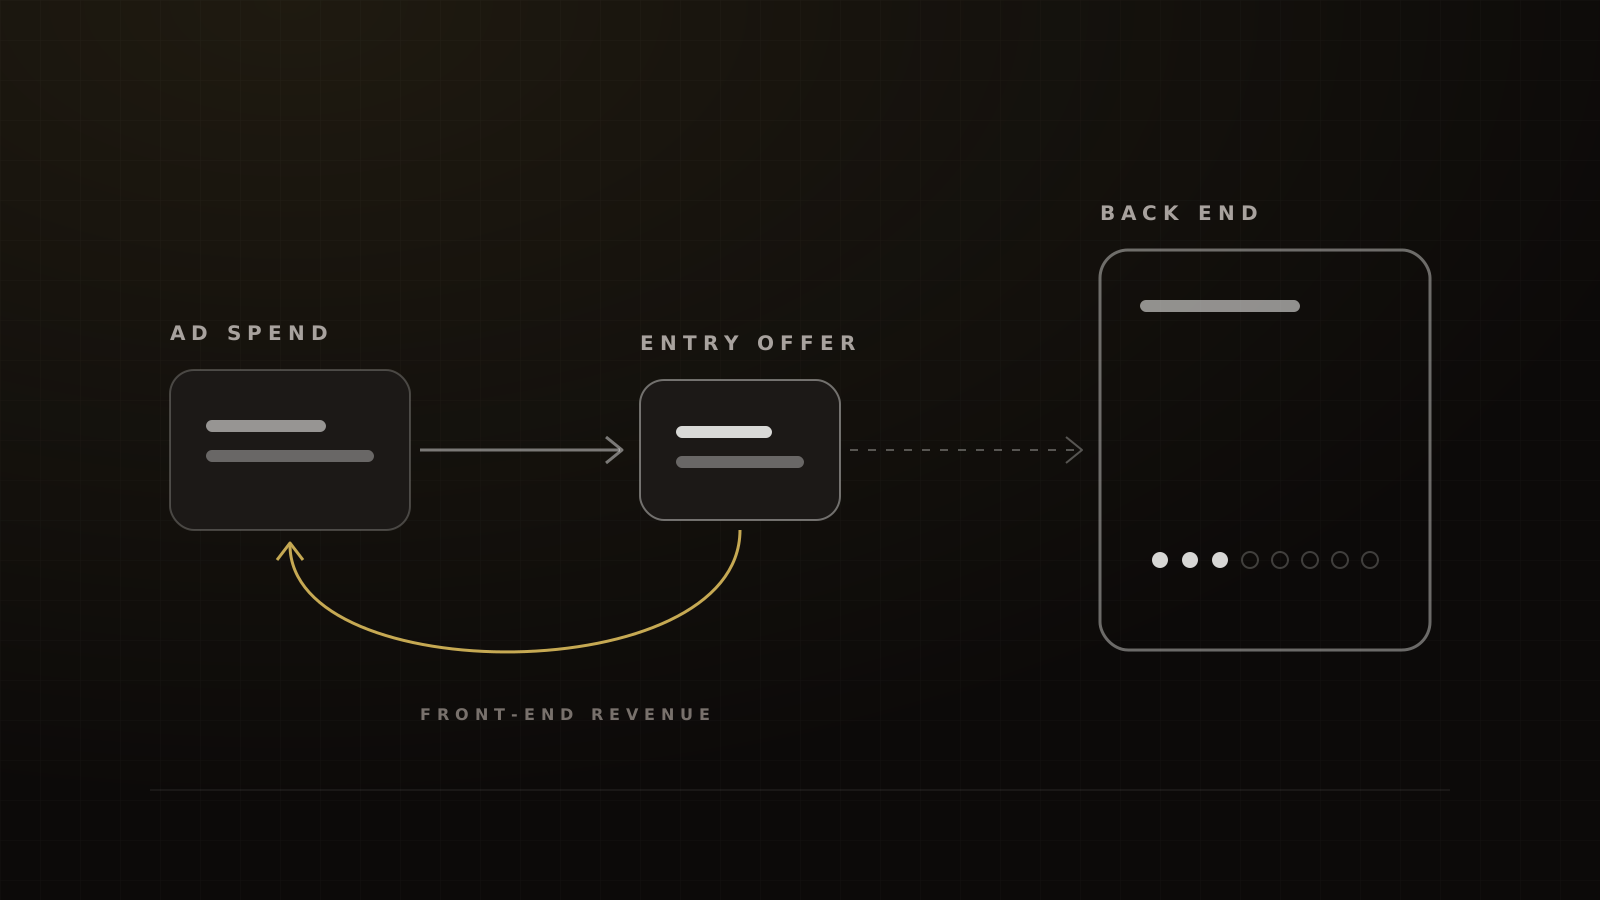
This is the rung that pays for the ads: a low-priced product sold to cold traffic, so that its revenue, plus bumps and upsells, wins back most or all of the ad spend. Brunson popularised the self-liquidating offer. The cheaper tripwire was documented by DigitalMarketer, which recapped Perry Belcher recommending low-risk tripwire offers at its 2014 summit.[9]
The right price depends on the buyer. For consumers, keep it under $100, and usually well under. Business owners will pay more, up to about $1,000, when they can treat the entry offer as an ROI decision. The rule underneath doesn't change: low enough to buy without a call.
On our funnels, cold traffic buys from a $7–$47 sales page at 3–6%. ClickFunnels estimates 3–5% for digital products under $50, and labels it an estimate.[10] No measured public benchmark exists.
What to sell at this price matters as much as the price. Ray's view is that courses alone are worn out here. A quiz, a calculator, an audit or a template gives a personal result and feels more like consulting than another video course, which makes a $20 or $27 offer an easy yes. The full build is in our guide to the self-liquidating offer funnel.
Order bumps and one-click upsells
The bump is a checkbox on the order form. The upsell is the one-click offer that follows the purchase. Both sell at the moment of highest intent, and both are easy to get wrong.
Vendor numbers on bumps vary even inside one vendor. SamCart's March 2026 guide says bumps convert 30–40%.[8] Its April 2026 page says 35–40%, and that adding a single one-click upsell lifts average order value by 68%.[11] That 68% is order-value lift, not a take rate, and neither page discloses a method. SamCart's featured seller ran a $47 product, a $47 bump and a $497 upsell for $154 per customer, with a 56% bump take and a 6.87% upsell take.[11] SamCart itself calls the 56% unusually high.
In our experience, a one-click upsell on a sub-$100 coaching front end takes 8–12%. The most useful placement data we've seen is Rokt Aftersell's 2026 report on 17 million Shopify sessions. The same post-purchase offer converted 6.96% at its best placement and as low as 0.18% at its worst.[12] One offer at a time converted 2.55%, against 1.67% when several were shown.[12]
That's physical goods, but the lessons travel. Placement matters more than the product, and one offer beats a menu.
Mid ticket: course, workshop, VIP
The mid-ticket rung solves the next problem. Typical forms are a $197–$997 course or workshop, a $2,000–$3,000 program or a paid VIP day. This is where a webinar earns its keep, as the presentation that sells the rung.
A weekly evening webinar program we run shows what a tuned presentation rung looks like. Our best webinar cost per lead was $8–10 for years. It's now $4–5, with ads running only in the 2 days before each session, and the program returns 4–7x ROAS week over week. For comparison, WordStream and LocaliQ's 2025 benchmark put the median Facebook leads-campaign cost per lead at $27.66 across industries.[13] Our own first cold test of a webinar usually lands at $12–20 per registration, before any tuning.
At this rung we default to one-time purchases and fixed-length cohorts (4, 6 or 8 weeks), not subscriptions. Subscription fatigue is real, one-time offers are cleaner to sell, and instructor-led cohorts get people to the finish more often. That's a default, not a law. Some of the communities we've built bill monthly, and they work.
High ticket: coaching, mastermind, done-for-you
High ticket is where the transformation happens and where the business makes its margin: $5,000 to $10,000 and up, usually sold on a call or from a stage, rarely through a checkout.
Two numbers matter here. On a $1,000–$10,000 webinar offer, we treat 6–10% of live attendees buying as what good looks like, and 1–3% as failing. There's no public benchmark for this; it's our bar. When the sale happens on a call, the booking window matters. Calls booked no more than about three days out show 82–88% for us. RevenueHero's 2025 data on high-volume B2B teams found an average no-show rate of 15.9%.[14]
Kajabi's data points the same way on price. Experts whose top offer was under $50 typically earned $178 lifetime, and 2.6% of them reached $100,000. Experts with at least one offer at $2,500 or more typically earned $174,730, and 62.4% reached $100,000.[5] Kajabi flags that successful experts grow into premium offers, so causation runs both ways. Still, a ladder with no top rung caps the business.
The whale rung, off the page
Anyone who sells high ticket long enough meets the buyer who asks whether there's anything bigger. Devin's view is blunt: you will get whales, and if you have nothing to sell them, you leave money on the table.
We've had a buyer ask for something bigger than the top package, and we built one on the call. That's the point of the whale rung. It exists and it's real, but it isn't on the page. A six-figure price on a landing page scares off the mid-tier buyer and does nothing for the whale, who should be on a call anyway.
Build it from what your best clients already ask for: more access, more speed, done-for-you instead of done-with-you, a private day, a retreat. Price it in the conversation.
Continuity: a rung or a sidecar
Continuity (a membership, a community, a monthly calls tier) can sit beside any rung. It raises lifetime value, and it brings churn and failed payments with it.
Recurly's July 2026 benchmarks put education subscription churn at 4.99% (3.30% voluntary, 1.69% involuntary), labelled a median annual rate.[15] The figures look monthly in scale, so confirm the period before you build a lifetime-value model on them. Recurly's 2026 subscription report, covering 2,200 businesses and 76 million subscribers, found that 53% of failed monthly payments were recovered, and that micro-offers converted 13% of buyers into recurring plans.[16]
If you run continuity, run failed-payment recovery from day one, and treat a small paid offer as a door into the recurring tier.
Rung economics: the table nobody publishes
Value ladder diagrams show price. They don't show what each rung costs you to sell, deliver and defend. Here's what belongs next to every rung.
Processing. Stripe's standard US rate is 2.9% + $0.30 per card charge, plus 1.5% for international cards. It charges $15 per dispute, and it doesn't return the original fee when you refund.[21] PayPal's US card rate is 2.99% + $0.49, and PayPal Checkout is 3.49% + $0.49.[22] The fixed fee is what hurts cheap rungs. On a $27 sale, Stripe keeps about $1.08, or 4%, before any refund.
Refund windows. Teachable's gateway default is a full refund within 14 days for course purchases.[23] Whatever your platform, the refund window is the period in which a "sale" isn't yet revenue.
Disputes. Visa's VAMP program divides fraud reports plus disputes by settled card-not-present transactions. Its US excessive-merchant threshold fell from 220 basis points to 150 on April 1, 2026, for merchants with 1,500 or more fraud reports and disputes a month.[24] Across Sift's network, the average chargeback rate rose from 0.17% in Q1 2025 to 0.26% in Q3 2025.[25] On event sales with a next-day kickoff, our target is a dispute ratio under 0.5%.
Delivery cost and people time. A $27 template costs almost nothing to deliver. A $3,000 cohort costs coaching hours. A $10,000 program costs a closer's commission, onboarding and support. This is the column that tells you whether a rung is profitable or just busy.
| Rung | Processing drag | Refund exposure | Dispute exposure | Delivery cost | People time | Next-rung job |
|---|---|---|---|---|---|---|
| Free | None | None | None | Hosting, content | Event or community staff | Sell the entry offer or a seat |
| Entry, under $100 | Highest as a share (the fixed fee) | High: impulse buys | Highest count | Near zero | Support tickets | Create a buyer, fill the calendar |
| Bump and upsell | Low (a bump rides the same charge) | Moderate | Low | Near zero | None | Lift order value |
| Mid ticket | Moderate | Depends on the window | Moderate | Coaching hours | Delivery team | Book the high-ticket call |
| High ticket | Low as a share | Depends on the contract | Low count, high value | Coaching, onboarding | Closer, coach, support | Retain, refer, step up |
| Continuity | A fixed fee every cycle | Every cycle | Recurring | Community upkeep | Moderators | Keep paying, ascend |
Fee and threshold figures come from Stripe, PayPal, Teachable and Visa as cited above. The other columns are qualitative. Fill them with your own numbers.
A worked example (illustration, not a client result)
Here's how a self-liquidating front end nets down. Every number below is made up to show the math.
| Line | Amount |
|---|---|
| Ad spend | $20,000 |
| 400 front-end sales at $27 | $10,800 |
| Bump at $17, taken by 140 buyers | $2,380 |
| One-click upsell at $197, taken by 40 buyers | $7,880 |
| Gross revenue (gross ROAS 1.05) | $21,060 |
| Processing fees on 440 charges | −$743 |
| Refunds at an assumed 8% of revenue | −$1,685 |
| Two disputes (lost sale plus $15 fee each) | −$96 |
| Net revenue (net ROAS 0.93) | $18,536 |
| Out of pocket | $1,464, about $3.66 per buyer |
Hypothetical figures throughout. Fees at Stripe's 2.9% + $0.30; the bump rides the front-end charge and the upsell is a separate charge. The refund and dispute assumptions are invented for the example.
The dashboard says 1.05. The bank says 0.93. That gap is why "1.0 ROAS is break-even" is wrong: at a gross 1.0, you're already paying to acquire buyers.
In this example that's still a good trade. 400 people paid you, and each of them is now cheaper to sell the next rung to than a stranger.
Making the front end pay for the ads
Cold traffic keeps getting more expensive. Meta reported that its average price per ad rose 12% year over year in Q2 2026, with ad impressions up 14%.[26] A Facebook lead costs a median $27.66 across industries, and that's a lead, not a buyer.[13]
So we don't run cold ads to a $3,000 offer. Selling five figures on the first touch is whale hunting. We'd rather sell a sub-$100 product that covers the cost of the ads, then sell the high ticket to a list of people who have already bought.
We fish with dynamite in the beginning.
Dan Kennedy's principle, repeated by both Brunson and Hormozi, is that the business able to spend the most to acquire a customer wins. A front end that breaks even is how you get to spend the most. Hormozi calls the goal client-financed acquisition: collect more gross profit in a customer's first 30 days than it cost to acquire them, so growth funds itself.
The targets we hold:
- Front-end ROAS of 0.8–1.2 at scale, judged on back-end CPA. There's no public benchmark for this. It's our target, and the goal is break-even, not profit.
- A 30-day cash multiple of at least 1.5x fully loaded acquisition cost before we raise spend. Hormozi's stated minimum is 2x. David Skok's rule for SaaS is lifetime value of at least 3x acquisition cost, recovered within 12 months.[27] Neither is a coaching benchmark.
Back-end CPA, not front-end ROAS. Marius's method: take the ad spend, subtract the net front-end revenue, and divide what's left by the number of high-ticket closes. Run it on pessimistic assumptions. A front-end ROAS target set too high can starve your closers of calls that would have closed profitably. Our SLO calculator walks through that math.
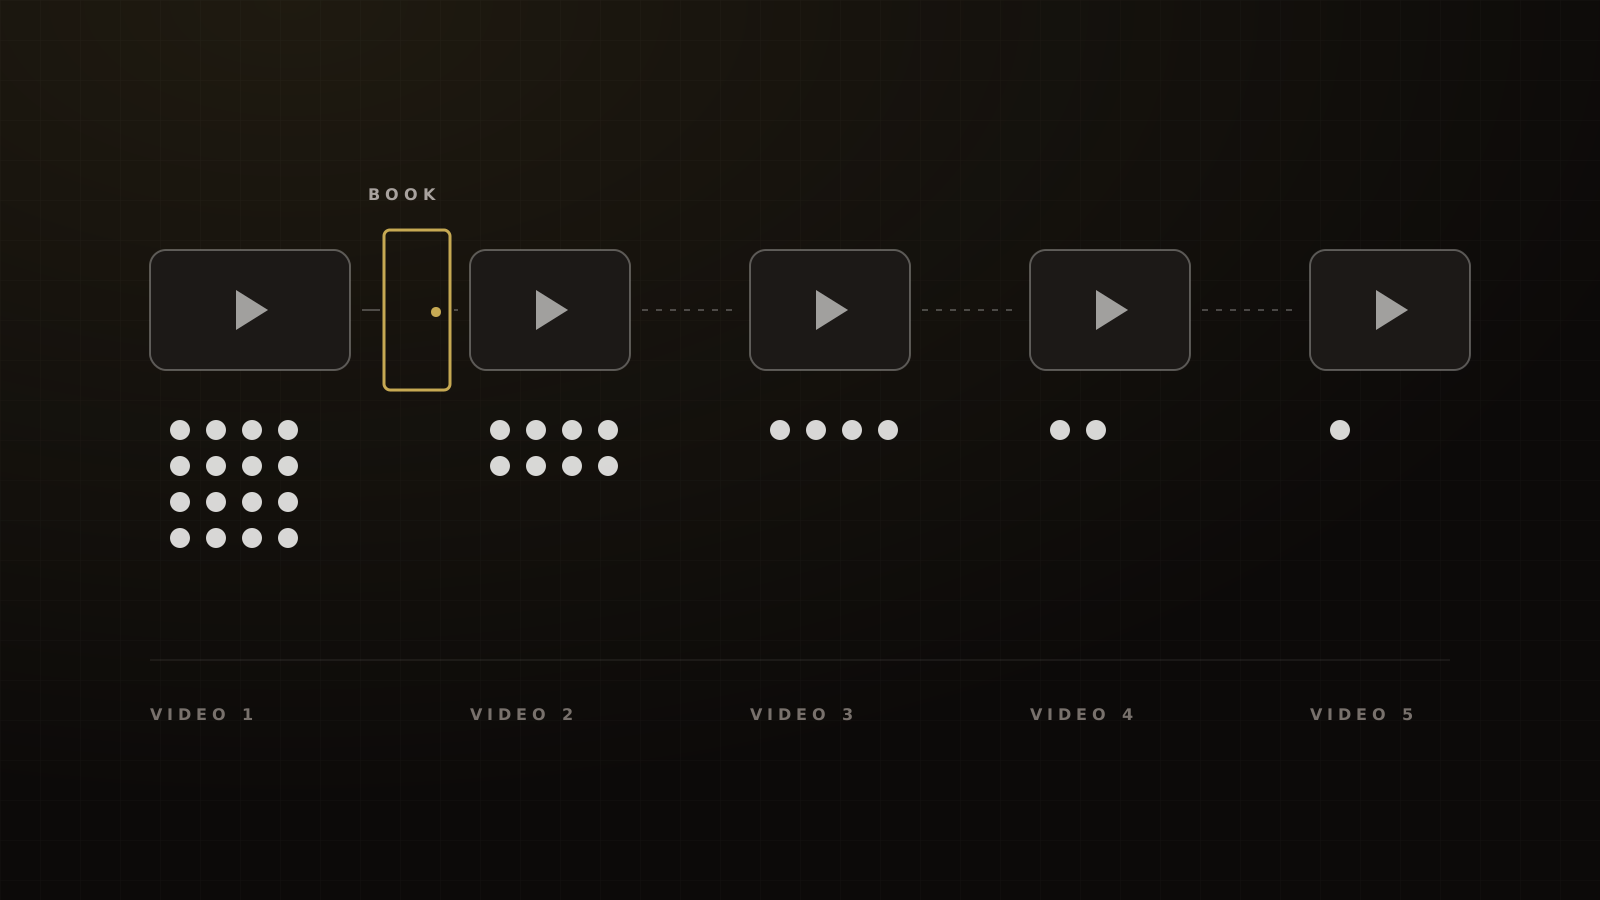
Gate the calendar. Low-ticket buyers who book a call straight from the receipt page often show up cold and confused. In our experience, each video in a post-purchase training keeps about half the previous video's viewers, so the booking link goes after video one, not video four. Wistia's 2025 data puts average engagement at 45–50% for videos under five minutes.[28] That measures how much of a single video people watch, a different metric from drop-off across a sequence, but it's the same warning. The full ascension sequence is in our low-ticket funnel guide.
Monetise the no. Buyers who don't qualify for the high-ticket offer still have a problem you can solve at a lower price. Give them a downsell (a smaller program, a group tier) or a free community instead of a closer's hour. Hormozi's offer stacking makes the same point: every no should have a smaller yes behind it.
When it's time to buy the traffic, our guide to paid ads for coaches covers the account side.
Price gaps, and how many offers to show
Devin's rule is that you wouldn't put a $1,000 upsell next to a $10,000 offer. Buyers drift toward the cheaper option when it's close enough to substitute. Rungs need enough distance between them to feel like different decisions, and a big offer sometimes has to stand alone. A $1,000 rung and a $5,000 rung can live together. A $10,000 offer is often a solo offer.
That's an operator rule, not a study. The research on how many options to show says less than the pricing blogs claim.
The famous jam study found that 30% of shoppers who stopped at a six-jam display bought, against 3% at a 24-jam display.[29] But a 2010 meta-analysis of 50 experiments found the average choice-overload effect was virtually zero (D = 0.02).[30] A 2015 meta-analysis found overload does appear under four conditions: a complex choice set, a difficult task, a buyer unsure of their own preferences, and the buyer's decision goal.[31]
So "fewer options always convert better" isn't established. What is established is narrower: when buyers are unsure and the options are hard to compare, more options hurt. That describes most coaching offers. Show one next step at a time, and keep the rest of the ladder for later conversations.
Grand Slam Offers on every rung
A ladder of weak offers is still weak. Hormozi's $100M Offers gives three tools that apply at every price point.
The value equation. Value rises with the dream outcome and the buyer's belief they'll get it, and falls with the time it takes and the effort it costs. Hormozi's argument is that the best offers win on the bottom half of that equation: faster and easier, not a bigger promise. A $27 tool that saves an hour this week often outsells a $27 course that promises a new life.
Trim and stack. List every obstacle between the buyer and the outcome, turn each into a solution and choose a delivery format for each. Then cut what's low-value and keep what's high-value, whether it's cheap or expensive to deliver. What survives becomes the stack.
Guarantees. His formula pairs a result and a time frame with a real consequence if you miss. Guarantees can be unconditional, conditional on the buyer doing the work, or implied through performance pricing. They reduce risk. They don't rescue a bad product.
On price, Hormozi is blunt: "Those who pay the most, pay the most attention." That's the case for a real top rung, not just a cheap front end. Offers built this way at each price point are in our Grand Slam Offer examples.
One compliance flag. Brunson's self-liquidating sales script includes a beat that floats a higher, fake price before revealing the real one. Don't use it. Anchor against real alternatives or a real former price.
How to audit your ladder this week
Ladder audit
- Name every rung and its job. If you can't say what a rung pays for, it's decoration.
- Check the gaps. Is any cheaper rung close enough to replace the one above it?
- Find the missing top. Is there anything to sell a buyer who wants more than your top package?
- Net the front end. Compute front-end ROAS after fees, refunds and disputes, not before.
- Compute back-end CPA. Ad spend minus net front-end revenue, divided by high-ticket closes.
- Gate the calendar. Does the booking link appear only after the buyer has consumed something?
- Give every no a downsell. Where does a buyer go when they don't qualify for the call?
- Check continuity terms. Clear terms before billing, express consent, an easy cancel.
- Build the cohort sheet. For each month's new buyers, track who bought what, in what order, how long between purchases, and revenue per original buyer at 30, 60 and 90 days.
The last item matters most, because it replaces the benchmark nobody has published. After one quarter you'll know your own ascension rate, and nobody else can tell you what it is.
If your ladder has a gap, a missing top rung or a front end that loses money after fees, that's exactly what we pressure-test on a strategy call.
Frequently asked questions
Sources
- 1.Is selling online courses profitable?. Kajabi, 2026-08-05.
- 2.Value ladder: what it is and how to build one. ClickFunnels, 2022-01-17, updated 2024-04-18.
- 3.$100M Money Models (Alex Hormozi), publication record. Google Books / Acquisition.com Publishing, 2025-08-16.
- 4.The value ladder explained. ClickFunnels, 2026-04-21.
- 5.The value ladder that actually works. Kajabi, 2026-08-05.
- 6.2025 Customer Growth Benchmarks. Bluecore, 2025.
- 7.Event Data Lab #05: no-show rates by ticket type and event size. PheedLoop, 2026-04-29.
- 8.The complete guide to order bumps. SamCart, 2026-03-30 (updated).
- 9.Shifts in digital marketing (Traffic & Conversion Summit 2014 recap). DigitalMarketer, 2014-01-24.
- 10.Traffic but no sales: conversion estimates by offer type. ClickFunnels, 2026-09-17.
- 11.How to increase average order value. SamCart, 2026-04-02 (updated).
- 12.2026 High Trust Revenue Report. Rokt Aftersell, 2026.
- 13.Facebook Ads Benchmarks 2025. WordStream / LocaliQ, 2025-09.
- 14.Ways to reduce no-show rates in sales calls. RevenueHero, 2025-08-18, updated 2026-04-24.
- 15.Churn rate benchmarks. Recurly, 2026-07 data.
- 16.Analyzing trends of 76 million subscribers (State of Subscriptions 2026). Recurly, 2026-01-14.
- 17.Custom Communications v. FTC, No. 24-3137. U.S. Court of Appeals, Eighth Circuit, 2025-07-08.
- 18.Negative Option Rule: advance notice of proposed rulemaking. Federal Trade Commission, 2026-03.
- 19.Back up those earnings claims: other lessons from the FTC's labor task force work. Federal Trade Commission, 2026-06-16.
- 20.Business Opportunity Rule: notice of proposed rulemaking. Federal Trade Commission, 2025-01-13.
- 21.Pricing. Stripe, undated, checked 2026-10-04.
- 22.PayPal business fees (US). PayPal, 2026-10-01.
- 23.Request a refund. Teachable Support, 2026-09 (updated).
- 24.Visa Acquirer Monitoring Program fact sheet. Visa, 2025.
- 25.Q4 2025 Digital Trust Index: disputes. Sift, 2025-Q4.
- 26.Meta reports second quarter 2026 results. Meta Platforms, 2026-07-29.
- 27.SaaS metrics: LTV:CAC. For Entrepreneurs (David Skok), undated, checked 2026-10-04.
- 28.Wistia's 2025 State of Video Report. Wistia via PR Newswire, 2025-03-26.
- 29.When choice is demotivating: can one desire too much of a good thing?. Iyengar & Lepper, Journal of Personality and Social Psychology, 2000.
- 30.Can there ever be too many options? A meta-analytic review of choice overload. Scheibehenne, Greifeneder & Todd, Journal of Consumer Research, 2010.
- 31.Choice overload: a conceptual review and meta-analysis. Chernev, Böckenholt & Goodman, Journal of Consumer Psychology, 2015.
Written by
Devin AlexanderCo-Founder & CEO
Devin architects Victory's revenue systems: team structure, comp plans, scripts and the accountability frameworks that make sales floors predictable. He has generated more than $150M in sales and trained more than 250 closers.