Self-Liquidating Offer Calculator: Front-End ROAS vs Back-End CPA
Judge a low-ticket front end on back-end CPA, not front-end ROAS. The inputs, formulas and pessimistic defaults, with a worked example and guardrails.
 Marius BulaiCMO & Head of Paid Media
Published 8 min read
On this page
Key takeaways
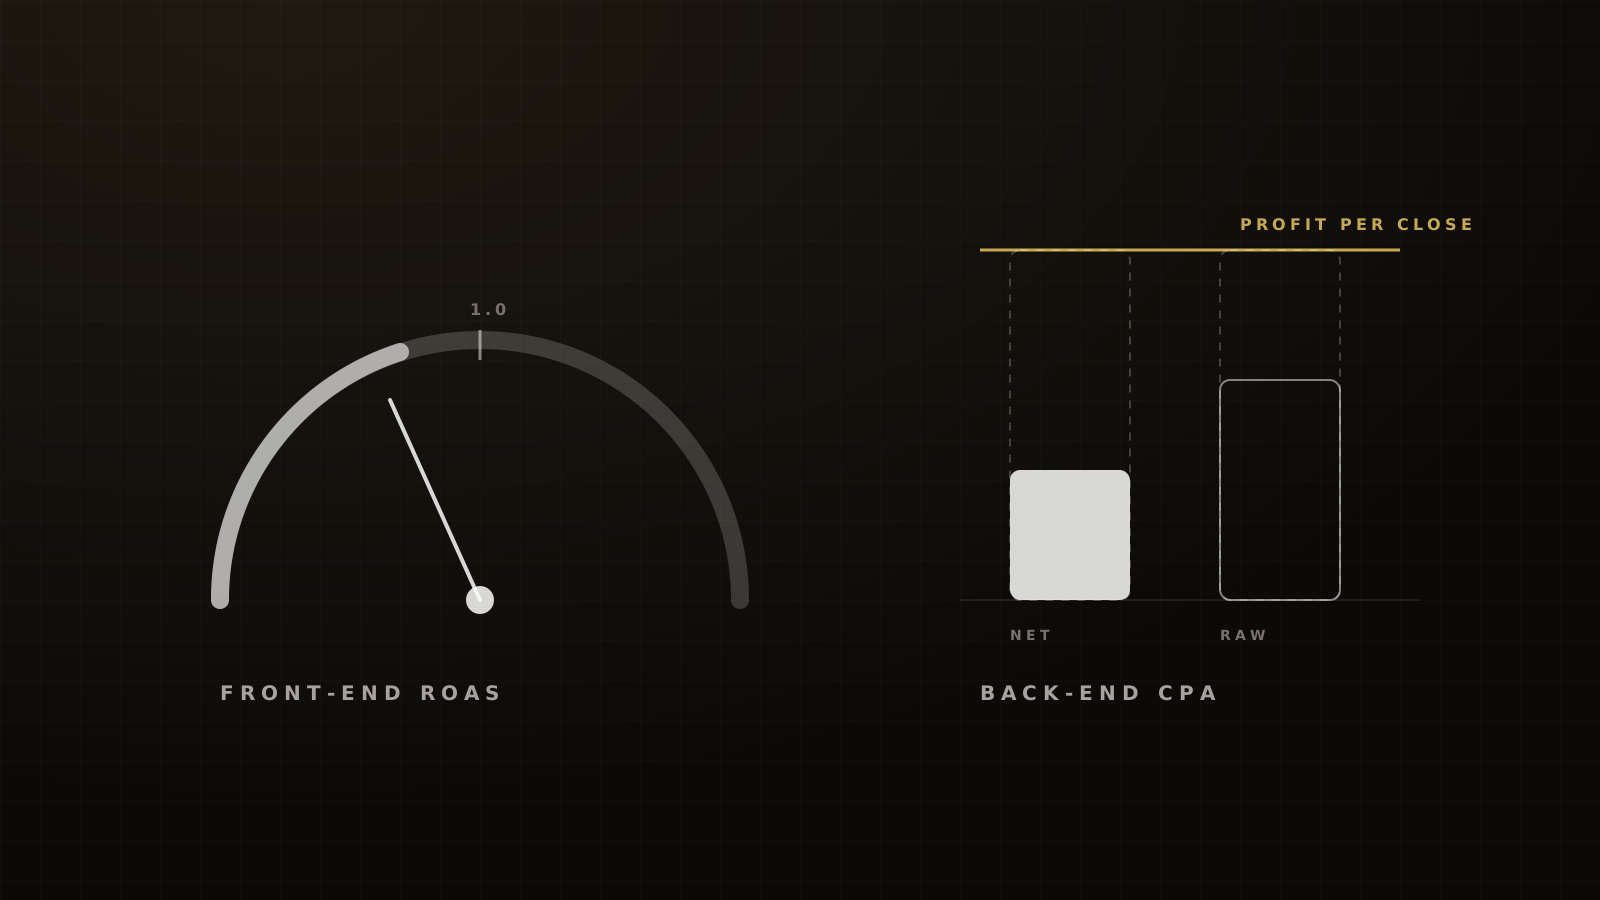
- Don't judge a self-liquidating front end on its own ROAS. Judge it on back-end CPA: residual ad spend divided by high-ticket closes.
- Residual ad spend is ad spend minus front-end revenue net of fees, refunds and chargebacks. It can go negative when the front end over-recovers.
- Adjust cost per call for show rate. A booked call that doesn't happen still cost you money.
- Ads Manager can't see a close made weeks later. Meta's default click window is 7 days.[1]
- The target we hold is 0.8–1.2 front-end ROAS at scale. A target set higher often starves closers of calls that would have closed profitably.
Front-end ROAS answers one question: how much of the ad spend did the entry offer win back? It doesn't answer the question that pays the bills: what did each high-ticket client cost?
For that, compute back-end CPA. Take ad spend, subtract front-end revenue net of fees, refunds and chargebacks, and divide what's left by the number of high-ticket closes. Then compute cost per booked call, adjusted for show rate. If back-end CPA sits comfortably under the gross profit of one high-ticket sale, the funnel works, even at a front-end ROAS below 1.0.
This is the method Marius uses on every two-stage funnel we run. Below are the inputs, the formulas, a worked example and the guardrails.
Front-end ROAS vs back-end CPA: two different questions
ROAS is a revenue ratio, not a profit ratio. Google's own definition is conversion value per dollar of ad spend: $5 in sales on $1 of spend is a 500% target ROAS.[2] Nothing in that number knows about fees, refunds, delivery cost or a sales team.
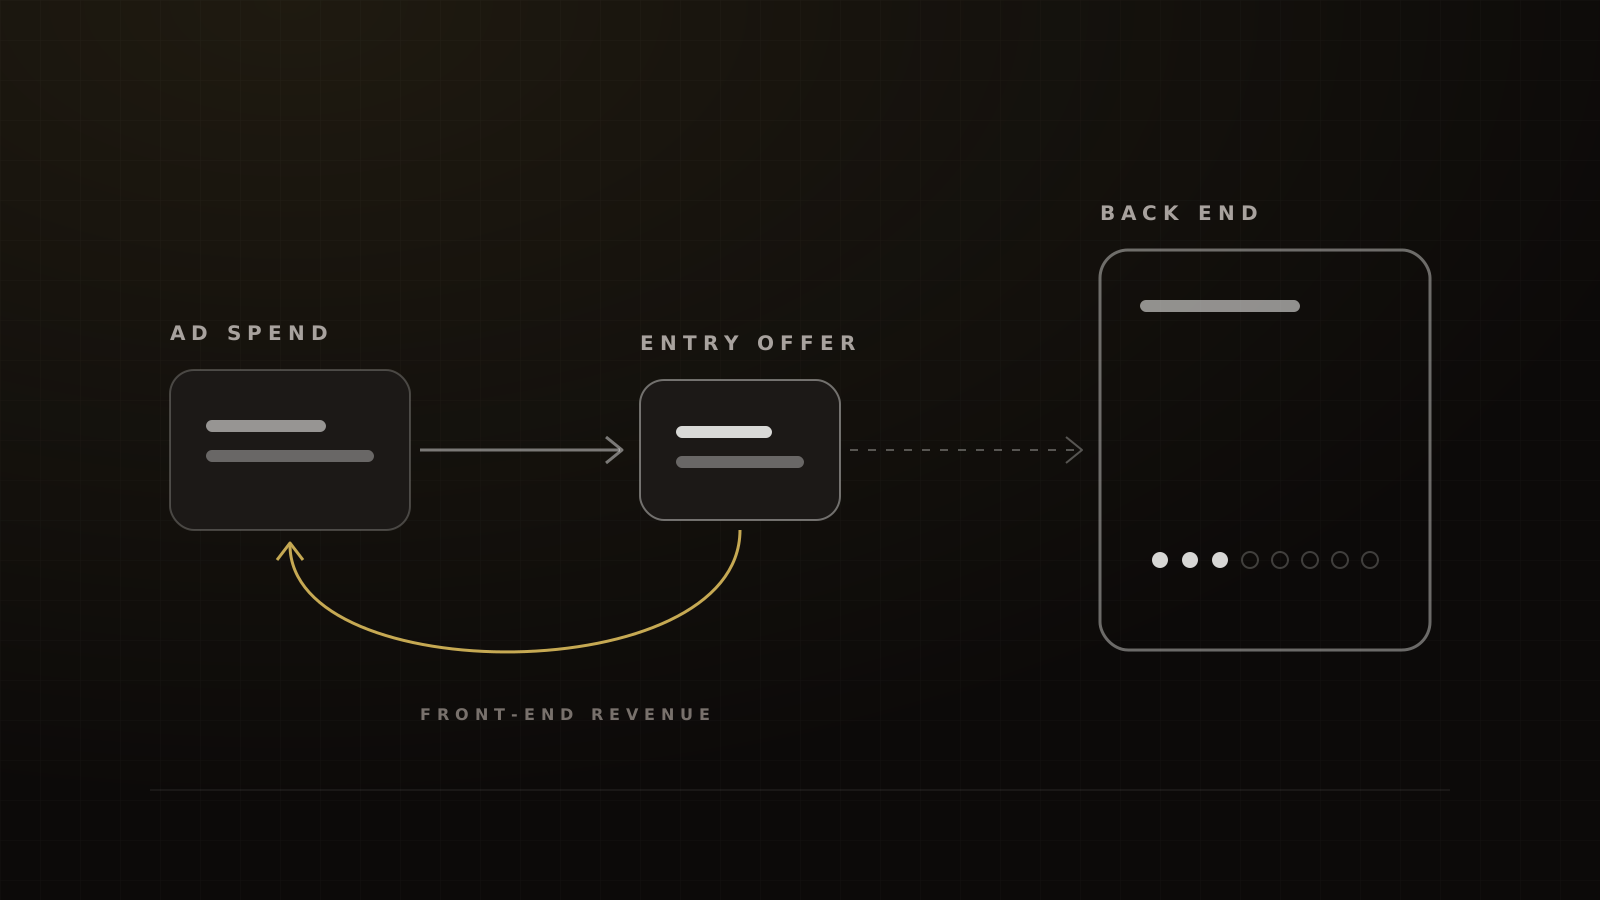
A self-liquidating funnel has two stages. The front end sells a cheap product and wins back ad spend. The back end, usually a closer on the phone, sells the high ticket weeks later. Front-end ROAS only sees stage one, and the ad platform often misses stage two entirely: Meta's default attribution is 7-day click, 1-day engage-through and 1-day view, per a secondary write-up of its 2026 change. Confirm the setting in your own account.[1]
Long-run rules of thumb exist, and none of them is a coaching benchmark. David Skok's SaaS rule is lifetime value of at least 3x acquisition cost, with acquisition cost recovered within 12 months.[3] Hormozi uses a similar 3:1 lifetime-gross-profit-to-CAC line in $100M Leads, and labels it plainly: "This is a pattern I personally observed, not a rule."
How the calculator works
The inputs
Use your own numbers wherever you have them. Where you don't, start pessimistic.
Inputs and where to get them
- Daily ad spend × days. From Ads Manager, for one cohort window.
- Front-end price, bump price and bump take rate. From your checkout. Use your own take rate after the first hundred orders.
- Upsell price and take rate. In our experience a one-click upsell on a sub-$100 front end takes 8–12%. For reference, Rokt Aftersell's best post-purchase placement converted 6.96% across 17 million Shopify sessions,[4] one SamCart seller's upsell took 6.87%,[5] and ThriveCart says 4–10% with no source given.[6]
- Processing fees. Stripe charges 2.9% + $0.30 per US card charge, $15 per dispute and another $15 if you counter one manually, refunded if you win. It keeps the original fee on refunds.[7] PayPal's US card rate is 2.99% + $0.49.[8] Count every separately charged upsell as its own charge.
- Refund rate. Your own. No credible public benchmark exists for digital products. Know your window: Teachable's gateway default is 14 days for courses.[9]
- Chargeback rate. Your own. For reference, Chargebacks911's 2026 merchant survey puts the "industry average" at 0.57% of transactions.[10]
- Buyer to booked-call rate. Your own. B2B form data is the nearest public reference: Chili Piper found 66.7% of qualified form fills booked with instant scheduling,[11] and RevenueHero reports a 62% median.[12]
- Show rate. Calls booked no more than about three days out show 82–88% for us. RevenueHero's 2025 data on high-volume B2B teams found a 15.9% average no-show rate.[13]
- Close rate, price, gross margin and commission. Your own. Gong's 2025 data shows B2B win rates of 21–26% per opportunity for deals under $250,000, which is per opportunity, not per held first call.[14]
If you have no front-end data yet, cold traffic buys from a $7–$47 sales page at 3–6% on our funnels, against ClickFunnels' estimate of 3–5% for digital products under $50.[15] For a webinar funnel with a paid bump after free registration, our experience is that the bump recovers about 40–50% of ad spend. There's no public benchmark for that.
The outputs
Framework
The SLO formulas
- Gross front-end ROAS = front-end revenue (product + bumps + upsells) ÷ ad spend.
- Net front-end ROAS = (front-end revenue − processing fees − refunds − chargeback losses and fees) ÷ ad spend.
- Residual acquisition spend = ad spend − net front-end revenue. It goes negative when the front end over-recovers. Always show raw ad spend per close beside it.
- Back-end CPA = residual acquisition spend ÷ high-ticket closes.
- Cost per booked call = residual spend ÷ booked calls. Cost per shown call = residual spend ÷ calls that happened.
- Closes to break even = residual spend ÷ gross profit per close (price × margin − commission).
- Flags: front-end ROAS outside 0.8–1.2, dispute ratio approaching network thresholds, closer calendars past 80%.
Back-end CPA method from Marius Bulai, Victory. Client-financed acquisition credited to Alex Hormozi ($100M Leads).
Calculator
Self-liquidating offer calculator
Judge the front end on what it recovers, then judge the funnel on back-end CPA: what each high-ticket client really cost.
Example inputs. Replace with your numbers.
Back-end CPA
$108
$1,282 residual ad spend ÷ 11.8 high-ticket closes
- Front-end ROAS, netGross 1.06x. Inside the 0.8–1.2 target we hold
- 0.96x
- Total ROASNet front end + back-end revenue
- 2.93x
- Net per buyerAfter ad cost, fees and back-end delivery
- $44.09
- Front-end buyers
- 909
- High-ticket closes
- 11.8
- Raw ad spend per close
- $2,538
Track the cohort in your CRM. Closes made weeks later sit outside Meta's default 7-day click window.
How this is calculated
- Front-end buyers = ad spend ÷ front-end CPA
- Net front-end revenue = buyers × (price + bump take rate × bump price + upsell take rate × upsell price) × (1 − fees, refunds and chargebacks)
- Front-end ROAS, net = net front-end revenue ÷ ad spend
- Residual ad spend = ad spend − net front-end revenue (negative when the front end over-recovers)
- High-ticket closes = buyers × back-end conversion
- Back-end CPA = residual ad spend ÷ high-ticket closes
- Total ROAS = (net front-end revenue + closes × back-end price) ÷ ad spend
- Net per buyer = (net front-end revenue + closes × back-end price × margin − ad spend) ÷ buyers
Estimates for planning, not a promise of results. The example inputs are illustrations, not Victory client results.
Worked example (illustration, round numbers)
Every figure below is hypothetical. One month of a $27 front end feeding a $5,000 program. Gross profit per close is $3,500 after delivery margin and commission. Both scenarios use the same rates: 10% of buyers book, 85% of booked calls show, 15% of shown calls close.
| Line | A: accept 0.6 net ROAS | B: hold a 1.2 target |
|---|---|---|
| Ad spend | $30,000 | $10,000 |
| Net front-end revenue | $18,000 | $12,000 |
| Residual acquisition spend | $12,000 | −$2,000 |
| Buyers | 900 | 400 |
| Booked calls / shown calls | 90 / 76 | 40 / 34 |
| High-ticket closes | 11 | 5 |
| Raw ad spend per close | $2,727 | $2,000 |
| Back-end CPA | $1,091 | negative |
| Cost per shown call | $158 | negative |
| Closes needed to break even | 3.4 | 0 |
| Cohort contribution | $26,500 | $19,500 |
Hypothetical numbers. Scenario B cuts spend to the best-converting audiences to hit a 1.2 net front-end ROAS.
Scenario B looks better on every front-end metric. It even makes money before a single close. But scenario A puts 42 more people in front of closers and contributes $7,000 more in the month, because the extra closes are worth far more than the front-end loss.
That's the trap. A front-end ROAS target set too high can starve your closers of calls that would have closed profitably. The target we hold is 0.8–1.2 at scale, and we only accept a lower front end, as in scenario A, when back-end CPA proves it out.
Five mistakes the calculator catches
- Gross vs net. A gross 1.0 ROAS is below break-even once fees, refunds and disputes come out. The net row is the one to manage. Our self-liquidating offer funnel guide shows the gap on a single test week.
- The wrong denominator for upsells. An upsell take rate is a share of buyers, not of visitors, and an order-value lift is not a take rate at all. Keep them apart, especially when comparing order bumps and upsells.
- Ignoring show rate. Cost per booked call flatters you. Cost per shown call is what the closers actually got.
- Reading Meta ROAS as the back end. Closes made in week three or four sit outside a 7-day click window. Track the cohort in your CRM.
- Scaling on blended returns. Google's Meridian documentation separates average ROI from marginal ROI, the return on the next dollar, and warns against extrapolating response curves beyond observed spend.[16] A funnel can average 0.9 while the last $500 a day returns far less.
Guardrails
Disputes. Visa's VAMP threshold for US excessive merchants dropped to 150 basis points on April 1, 2026, for merchants with 1,500 or more fraud reports and disputes a month.[17] Braintree publishes Mastercard's excessive-chargeback level as 100–299 chargebacks and a 1.5–2.99% ratio, both required; confirm current thresholds with your acquirer.[18] Our own target is a dispute ratio under 0.5%.
Closer capacity. We cap closer calendars at 75–80% of available slots, and our working assumption is that one full-time closer holds 4–6 high-ticket calls a day at that fill. For context, Salesforce's 2026 survey found reps spend 40% of their week selling,[19] and Bridge Group's 2025 report puts SDRs at 4.1–4.6 quality conversations a day.[20] If the calculator's booked calls exceed your closers' capacity, the next dollar of ads buys nothing.
Cash before scale. Before raising spend, the target we hold is a 30-day cash multiple of at least 1.5x fully loaded acquisition cost. Hormozi's stated minimum for customer-financed acquisition is 2x.
Stress-test. Run 7 days at the planned daily spend on a capped audience, or until about 50 optimisation events, before scaling. Meta's learning phase ends after about 50 results in the week after the last significant edit.[21]
The full ladder this calculator sits inside is in our offer architecture pillar, pricing the entry offer is covered in low-ticket offer pricing, and buying the traffic is covered in paid ads for coaches. If you want us to run your numbers through it, book a strategy call.
Frequently asked questions
Sources
- 1.Meta attribution change 2026: what engage-through attribution is. Dataslayer (secondary, citing Meta), 2026-04-09.
- 2.About Target ROAS bidding. Google Ads Help, living doc, checked 2026-10-04.
- 3.SaaS metrics: LTV:CAC. For Entrepreneurs (David Skok), undated, checked 2026-10-04.
- 4.2026 High Trust Revenue Report. Rokt Aftersell, 2026.
- 5.How to increase average order value. SamCart, 2026-04-02 (updated).
- 6.Upsell solutions for course creators. ThriveCart, 2026-07-28 (updated).
- 7.Pricing. Stripe, undated, checked 2026-10-04.
- 8.PayPal business fees (US). PayPal, 2026-10-01.
- 9.Request a refund. Teachable Support, 2026-09 (updated).
- 10.2026 Chargeback Field Report. Chargebacks911, 2026-06-30.
- 11.2025 Form Conversion Benchmark Report. Chili Piper, 2025-02-18.
- 12.Industry benchmarks for inbound meeting conversion. RevenueHero, 2026-02-20.
- 13.Ways to reduce no-show rates in sales calls. RevenueHero, 2025-08-18, updated 2026-04-24.
- 14.The State of Revenue 2025. Gong, 2025.
- 15.Traffic but no sales: conversion estimates by offer type. ClickFunnels, 2026-09-17.
- 16.ROI, mROI and response curves. Google (Meridian docs), 2026.
- 17.Visa Acquirer Monitoring Program fact sheet. Visa, 2025.
- 18.Mastercard Excessive Chargeback Program (as published by Braintree). Braintree (PayPal) developer docs, undated page, thresholds effective 2019-10.
- 19.State of Sales, 7th edition. Salesforce, 2026-02-03.
- 20.2025 SDR Models and Metrics Report. The Bridge Group, 2025-02-06.
- 21.About the learning phase. Meta Business Help Center, living doc, read 2026-10-04.
Written by
Marius BulaiCMO & Head of Paid Media
Marius runs all paid media strategy and execution at Victory. Before Victory he was Head of Analytics at Hyros, inside the data of some of the largest ad accounts in the world.
Part of the guide: Offer Architecture: Value Ladders, Grand Slam Offers and Self-Liquidating Front Ends