Webinar Conversion Rate Benchmarks: Show-Up, Offer and Close Rates (and Which Denominators Matter)
Webinar conversion rate means three different numbers. Every public benchmark on one denominator, why none covers buyers, and what good looks like.
 Ray GillespieCo-Founder & COO
Published 9 min read

On this page
Key takeaways
- "Webinar conversion rate" means three different numbers: visitor to registrant, registrant to attendee, and attendee to buyer. Most pages quote the second and call it the third.
- Public registrant-to-attendee figures run from about 21% to 60%, and most of that spread is the denominator, not performance.
- Goldcast headlined 33% attendance for 2024, but its own averages work out to 21.4%.[1]
- We found no public, method-disclosed attendee-to-buyer benchmark for coach or expert webinars. Our rule of thumb on $1K–$10K offers: 6–10% of live attendees buying is good, 1–3% is failing.
- The number to manage is revenue per registrant against cost per registrant.
"Webinar conversion rate" means three different things: visitor to registrant, registrant to attendee, and attendee to buyer. The pages that rank for the term mostly quote the second and call it the third.
The public platform reports put registrant-to-attendee anywhere from about 21% to 60%, depending on how they count. We couldn't find a public, methodology-disclosed attendee-to-buyer benchmark for coach or expert webinars. So you have to measure your own, on fixed denominators.
Here is every public number on the same footing, the operator ranges we work to, and how to build your own scorecard.
Three conversion rates, not one
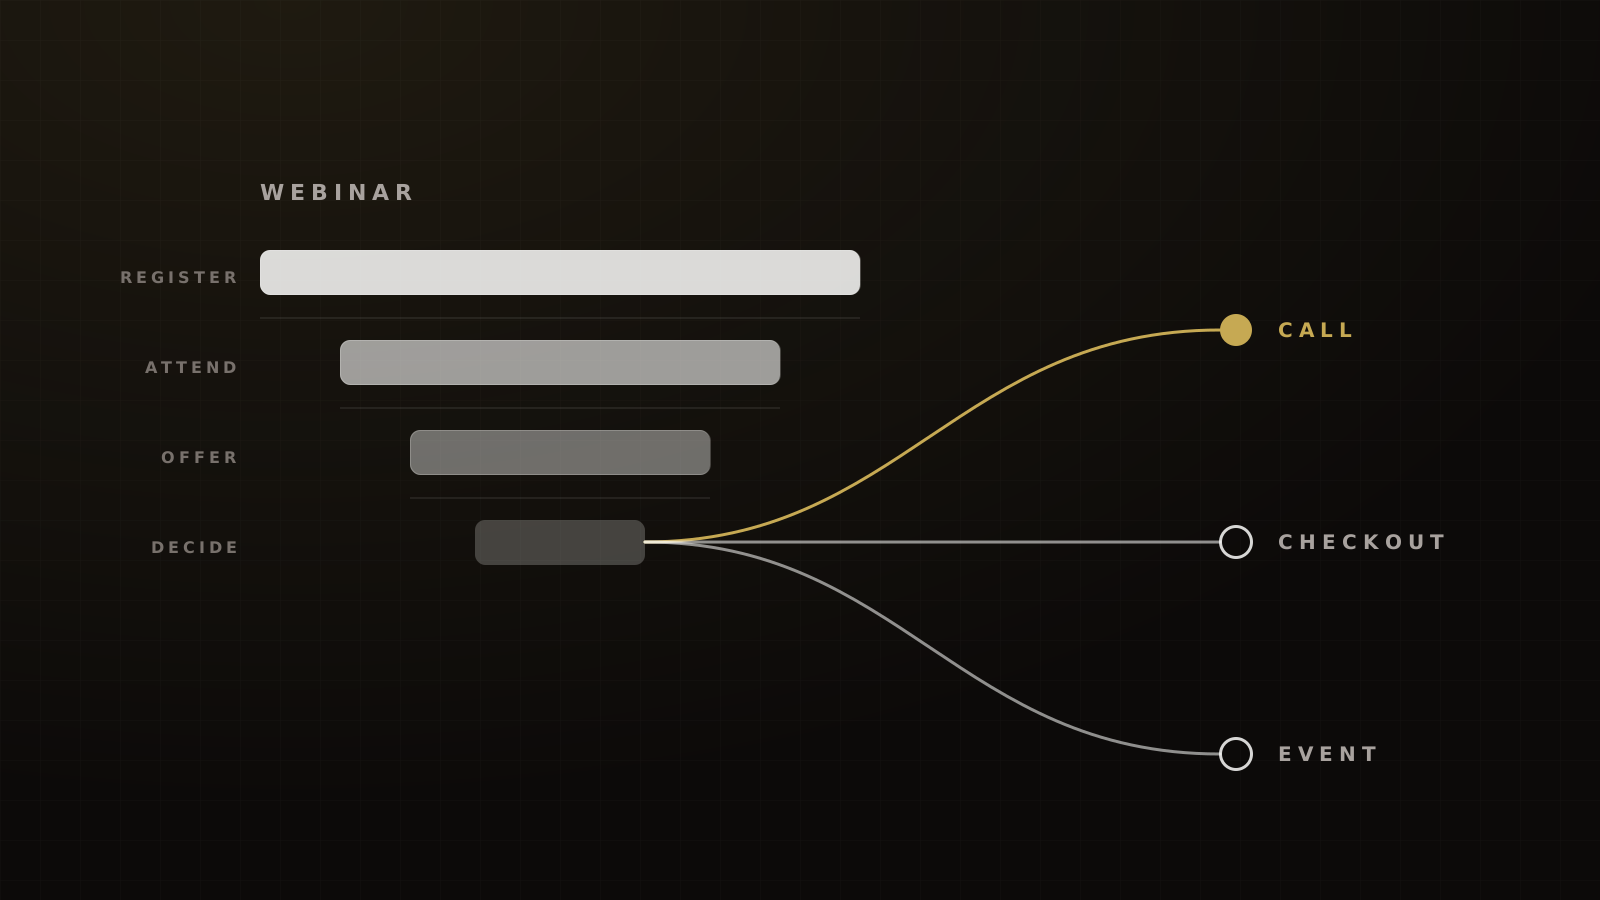
A webinar's revenue is four numbers multiplied together:
registrants × live show rate × attendee-to-buyer rate × price
Each public benchmark sits at one point in that chain, and they're rarely labelled. Before you compare yourself with any figure, check which link it measures and what it divides by.
The chain starts one step earlier, at the ad. On a working webinar ad, we typically see a cold Meta link CTR of 1.8–2.5%. LocaliQ's 2026 average for Education & Instruction lead campaigns is 1.74%.[2]
Visitor → registrant
GetResponse's landing pages that promoted a webinar converted 22.3% of visitors in 2023, about twice the 10.76% average across all its landing pages.[3] That data is about three years old and the sample size for webinar pages isn't stated separately, but it's the cleanest public figure.
On the funnels we run, a free webinar registration page converts 22–30% of cold Meta visitors. Warm traffic from your own list converts higher.
This is also the first place "conversion rate" gets muddled. TwentyThree's own help center defines webinar conversion rate as registrations divided by registration-page views.[4] That's a page metric. It tells you nothing about buyers.
Registrant → attendee: the denominator table
This is where the headline numbers live, and where they disagree most. Here they are side by side, with what each one actually counts.
| Source (data year) | Headline | Recomputed | What it counts |
|---|---|---|---|
| Goldcast 2025 report (2024)[1] | 33% | 51 ÷ 238 = 21.4% | Averaging method not stated |
| Goldcast 2026 report (2025)[5] | 40% | 102 ÷ 251 = 40.6%; platform totals 32.7% | Same problem, a year later |
| Livestorm 2026 report (2025)[6] | 47.7% live; same page also says 51.3% | 83 ÷ 175 = 47.4% | Live attendees ÷ registrants |
| ON24 2025 report (2024)[7] | 57% | n/a | Doesn't say whether on-demand counts |
| ON24 2026 report (2025)[8] | 60% "total" | n/a | Includes on-demand viewers |
| Contrast 2026[9] | 61% live or replay | Live about 44–50% | Three denominators on one page |
| Univid 2026[10] | 49% live; 57% live plus replay | n/a | Medians |
| Demio 2024 report (2023)[11] | Education Services 20%; hosts under $1M revenue 22% | n/a | Attendees ÷ registrants |
| Victory, cold traffic | 25–35% live | n/a | Single-date evening webinar, cold Meta traffic |
| Victory, warm list | 40–50% live | n/a | Email, SMS or community registrants |
Recomputed ratios are our arithmetic from figures in the same report. Victory rows are operator ranges from our experience, not a dataset.
Why Goldcast's 33% isn't 51 ÷ 238
Goldcast's 2025 report covers 19,531 single-session B2B webinars. It says the average attendance rate was 33%. The same report gives 238 average registrants and 51 average attendees per webinar, which is 21.4%.[1] Goldcast doesn't explain the gap.
The likeliest reason is the averaging method. Averaging each webinar's rate gives small webinars, which post high percentages, the same weight as big ones. Dividing averages, or totals, weights by audience.
The 2026 report does it again. It headlines 40% for 2025. Average attendees over average registrants gives 40.6%. Platform totals, 2,220,718 attendees from 6.8 million registrants, give 32.7%.[5]
Goldcast's headline 2025 attendance rate, against platform-wide attendees divided by platform-wide registrants
"Total" isn't live
ON24 reports 60% registrant-to-attendee conversion for 2025 and labels it "total", so on-demand viewers are in it.[8] Its 57% for 2024 doesn't say either way.[7] Contrast's 61% counts people who watched live or the replay; its live figure is about 44–50%.[9]
If your platform reports one blended number, split it. Livestorm's definition is the one to copy: live attendees divided by registrants, with replay viewers tracked separately.[12]
Small rooms post bigger percentages
In Goldcast's 2025 data, Monday webinars averaged 106 registrants and 47.2% attendance. Thursday webinars averaged 486 registrants and 38.7%.[5] Contrast shows the same slope: 37% live attendance at 1,000 or more registrants, against 44% at 100 to 1,000.[9]
So a 60% show on 80 registrants isn't better than 35% on 900. The second webinar put more than six times as many people in the room. When you compare sessions, compare ones of similar size.
The proxy that fits coaches
Most platform datasets are B2B, and most of their registrants come from house lists. That's why they cluster around 40–50%, which is also what we see on warm lists.
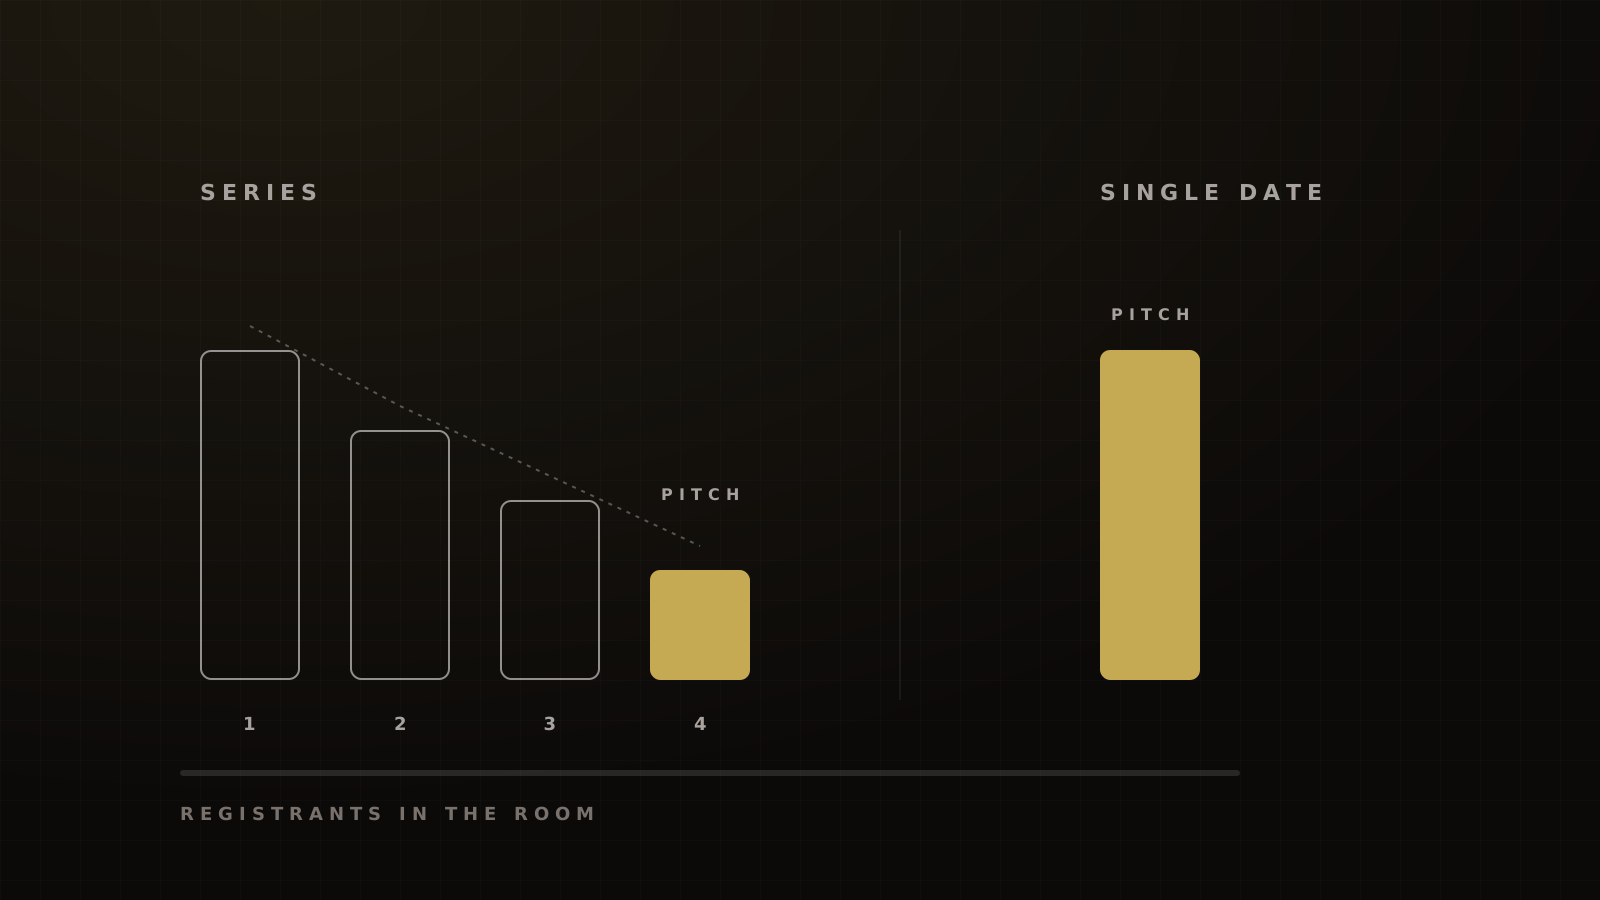
The closest public proxy for a small coaching business buying cold traffic is Demio's: 20% for Education Services and 22% for hosts with under $1M in revenue, against 41–48% for larger companies.[11] It's 2023 data, now nearly three years old. On cold traffic to a single-date evening webinar, we see 25–35%. If you're well below 20%, look at the show system first: the confirmation page, reminders and deliverability. Our full show-rate breakdown is in the webinar funnel playbook, and the single biggest format mistake we see is in why a multi-part webinar series kills show rate.
Attendee → buyer: why there's no public benchmark
None of the platform reports above publishes an attendee-to-buyer rate for coaching or course webinars. What they measure instead is clicks. Univid's "22% CTA conversion", for example, counts clicks on a call to action, not purchases.[10] WebinarJam computes sales conversion only on attendees who entered the room, with replay sales reported separately.[13]
What's left are operator claims and single cases. Treat every one as a data point, not a benchmark.
- Brunson's figures. He has said a typical webinar shows about 25% of registrants, that 5% of attendees buying is a good webinar, 10% is one that can scale, and that his own ClickFunnels webinar closed 15% after running nearly 70 times.[14]
- Hormozi's goal. For a free 90-minute masterclass, his stated goal is converting about 10% of attendees.[15]
- A $1,997 affiliate webinar (2020). 34 of the 295 people present at the pitch bought, 11.5%.[16] That denominator is people still there at the pitch, not all attendees, and it's a selected success story.
- Thinkific's Black Friday webinar (2024). 50 buyers during the live session from about 866 attendees and 3,821 registrants.[17] That's about 5.8% of attendees and 1.3% of registrants, our arithmetic.
Our rule of thumb on $1K–$10K offers: 6–10% of live attendees buying is what good looks like. At 1–3%, something is broken. This isn't a dataset; it's the bar we hold our own webinars to.
When the number is low, fix the offer before the room. That's also Jason Fladlien's order of optimization: offer first, then audience, then message. A bigger room converting 2% is still converting 2%.
For webinar-to-call funnels, "buyer" is a held call first. In our experience, calls booked no more than about three days out are held 82–88% of the time, against an average B2B sales-meeting no-show of 15.9% in RevenueHero's data.[18] How the pitch itself gets more people through the door is in the webinar pitch structure.
The number we actually manage to: revenue per registrant
Show rate and buyer rate are diagnostics. The number that decides whether to scale is revenue per registrant, set against cost per registrant.
On our weekly evening webinar, leads cost $4–5 and the program returns 4–7x ROAS week over week. Put those together and every dollar spent buying a registrant comes back as four to seven. As an illustration only: a $5 registrant at 5x ROAS is worth $25 in revenue.
Public cases with a real denominator are rare and old. The 2020 affiliate webinar above reports $149.55 of revenue per registration across the live session, an encore and follow-up.[16] A SaaS company reported $55 per registrant within 30 days in 2017.[19] Different offers, different eras. They show the math, not a target.
Expect a worse number on your first run. A first cold-traffic test usually comes in at $12–20 per registration in our experience, before any tuning. WordStream's 2025 median for Meta lead campaigns in Education & Instruction is $28.22.[20] Plug your own inputs into the webinar funnel calculator to see what revenue per registrant you need to break even.
Any revenue example here is an illustration, not a typical result.
Myths to stop quoting
- "The average webinar conversion rate is 56%." DemandSage's 56% traces to ON24's 2023 registrant-to-attendee figure.[21] It's attendance.
- "Live webinars convert 63%, on-demand 19%." TwentyThree's figures don't state a denominator.[22] Its own help docs define conversion as registrations over page views.
- "40–50% attendance is average." Pages like AEvent repeat it with no source.[23] We traced it to an old vendor dataset we couldn't open, so we don't use it.
- "73% of B2B marketers say webinars generate the best leads." It's a 2017 XANT survey of 678 leaders, where webinars ranked second behind small executive events.[24]
- "10–20% of live attendees buy." WebinarKit calls this the generally accepted average, with no dataset behind it.[25]
- "20–40% of B2C attendees become leads." DemandSage states it with no source.[21]
How to measure your own
Your webinar scorecard
- Fix every denominator. Write down what each rate divides by, and never change it between sessions.
- Count unique registrants. Deduplicate people who register twice or for several dates.
- Separate live from replay. Live attendees over registrants is your show rate. Replay viewing is its own number. Zoom's attendee report marks each registrant as attended or not, which gives you the clean live figure.[26]
- Track who stayed to the pitch. Attendee-to-buyer is distorted if half the room left before the offer.
- Set the attribution window before you start. In our experience, 30–50% of a webinar's sales close after the live session, so judge each webinar over the full follow-up window, not the night.
- Report revenue per registrant against cost per registrant, every session.
Get a funnel audit
If your webinar is getting registrations but not buyers, the leak is usually at one link in the chain, and the denominators above will show you which. Book a call with us and we'll audit the funnel stage by stage, or read more on fixing funnel conversion in our CRO guide.
Frequently asked questions
Sources
- 1.B2B Webinar Benchmark Report 2025. Goldcast, 2025.
- 2.Facebook Advertising Benchmarks 2026. LocaliQ, 2026-09-23.
- 3.Email Marketing Benchmarks (2024 edition). GetResponse, 2024.
- 4.Webinars: understand key analytics and attendance data. TwentyThree Help Center, 2018-10-08.
- 5.B2B Webinar Benchmark Report 2026. Goldcast, 2026.
- 6.Webinar Benchmark Report 2026. Livestorm, 2026-09-01.
- 7.Key takeaways from the 2025 Webinar Benchmarks Report. ON24, 2025-02-20.
- 8.Webinar guide (citing the 2026 Webinar Benchmarks Report). ON24, 2026, page undated.
- 9.Webinar statistics 2026. Contrast, 2026-05-26 (updated).
- 10.Webinar statistics 2026. Univid, 2026 (data to 2026-08-31).
- 11.Webinar Statistics 2024. Banzai (Demio), 2024-01.
- 12.How to boost your webinar attendance rate. Livestorm, 2026-03-26.
- 13.View webinar analytics. WebinarJam Help Center, living doc, checked 2026-10-04.
- 14.The playbook to a high converting webinar (Perfect Webinar). ClickFunnels blog (Russell Brunson), 2016-01-18, updated 2026-03-19.
- 15.Attraction Offer: Free Presentations ($100M Lost Chapters audiobook), episode page. The Game with Alex Hormozi, via Wave, 2025-11-14.
- 16.Case study: $123,535.00 revenue from 826 webinar registrations. Seven Figure Blueprints, 2020-03-18.
- 17.How Thinkific found webinar success with Demio. Demio (Banzai), 2024-09-04.
- 18.Ways to reduce no-show rates in sales calls. RevenueHero, 2025-08-18.
- 19.Facebook ads for SaaS startup lead generation (FunnelDash case study). Demio (Banzai), 2017-12-20.
- 20.Facebook Ads Benchmarks 2025. WordStream by LocaliQ, 2025, modified 2026-09-14.
- 21.Webinar statistics. DemandSage, 2025-07-09, modified 2025-12-31.
- 22.State of Webinars 2026. TwentyThree, 2026.
- 23.Average webinar conversion rate. AEvent, undated (2025 footer).
- 24.Optimal Lead Generation Methods. XANT (InsideSales.com), 2017.
- 25.Webinar conversion rate benchmarks 2026. WebinarKit, 2026-07-08.
- 26.Webinar attendee report. Zoom Support, living doc, checked 2026-10-04.
Written by
Ray GillespieCo-Founder & COO
Ray runs day-to-day operations across every Victory engagement, building the systems, automations and AI-powered workflows that hold the machine together. He has overseen operations behind more than $120M in revenue.
Part of the guide: The Webinar Funnel Playbook: Live, Automated and Hybrid Webinars That Sell (2026)