Course Completion and Community Retention Statistics: What the Research Says and Why Paying Changes Behavior
Course completion and membership churn statistics traced to their studies, with samples and dates, and why paying changes how people finish.
 Ray GillespieCo-Founder & COO
Published 9 min read
On this page
- Where the "5–15%" numbers come from
- Completion depends on who you count
- What happens when people pay
- The catch: paying gets people to start, not to show up
- What actually raises completion (the randomized evidence)
- Community and membership retention: what's published
- Numbers you'll see that have no source
- How to measure your own
Key takeaways
- The famous low completion numbers come from free MOOCs. Across 221 MOOCs the median completion rate was 12.6%, and only 3.13% of all edX participants finished in 2017–18.[1][2]
- Paying changes the picture. 46% of paid verified edX learners finished, and in one early Coursera class, 74% of payers finished against 9% of everyone else.[2][3]
- Most of that gap is selection. Among highly committed students, payers finished at 96% and non-payers at 84%.[3] A price filters for commitment and adds a stake on top.
- Paying gets people to start, not to show up. Gym members on monthly contracts paid more than $17 a visit when a $10 pass existed.[4]
- Cheap nudges don't fix completion at scale. Commitment devices, real stakes and structure do better.
The "5–15% completion" figures you've seen describe free MOOCs, not paid programs. Across 221 MOOCs the median was 12.6%. Only 3.13% of all edX participants finished in 2017–18.[1][2]
People who pay finish at several times that rate. Paid verified edX learners finished at 46%.[2]
Paying works mostly by selecting committed people and giving them a stake. It gets them to start. Design and accountability get them to finish.
Below, every figure is traced to its study, with the sample and the date. Most of the numbers that circulate without a source are collected near the end.
Where the "5–15%" numbers come from
The low completion figures are real. They're just about free courses, and they're old.
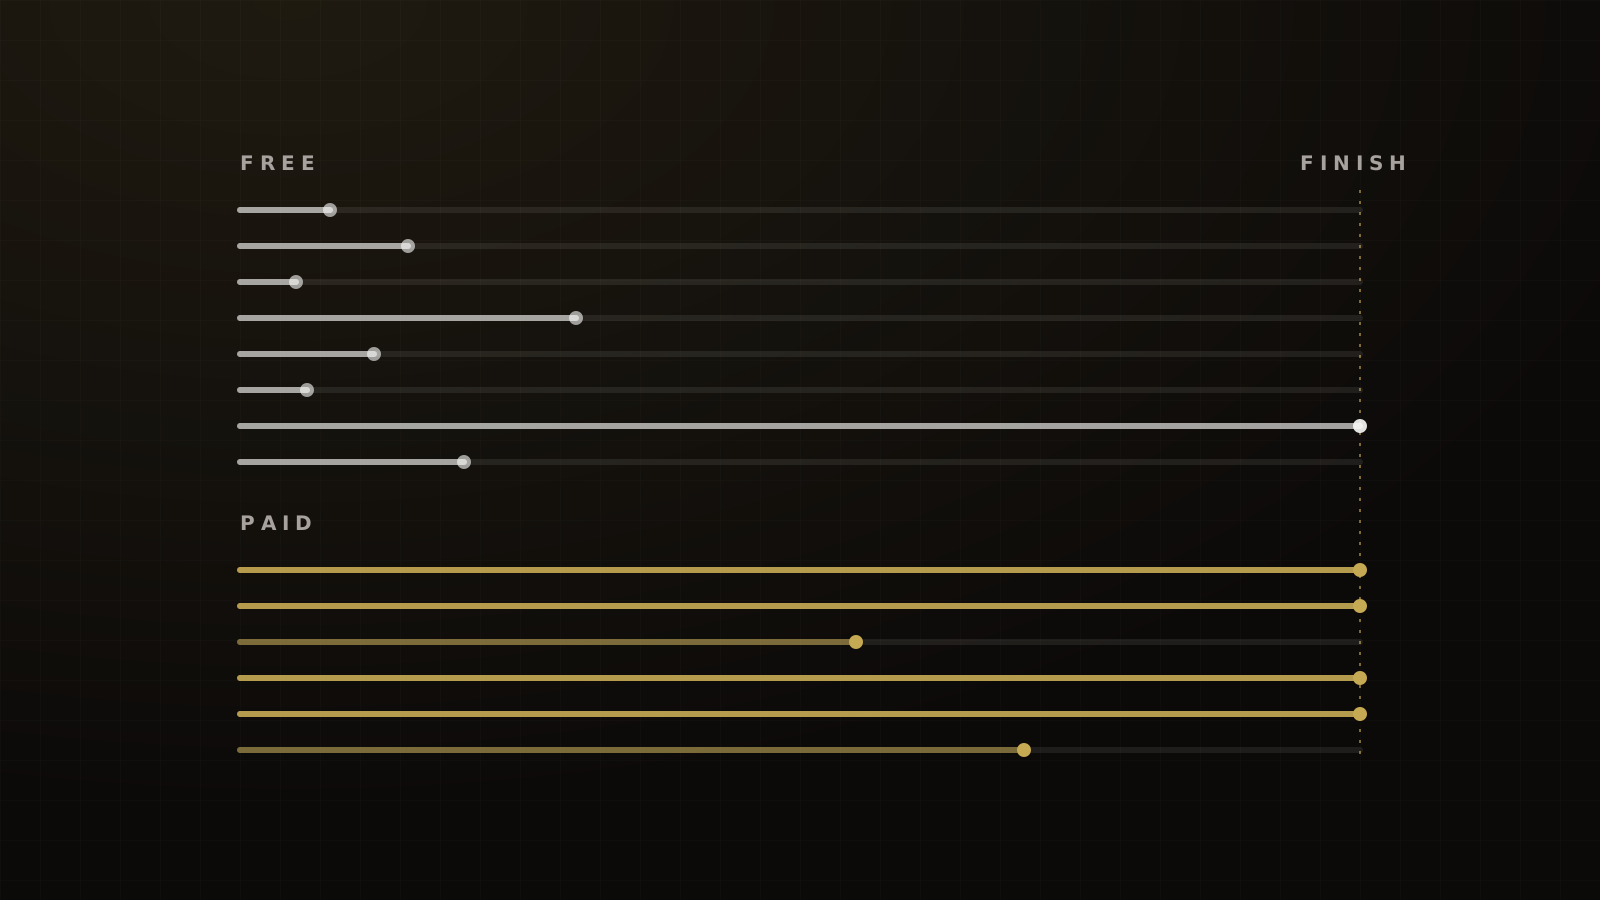
Completion among all edX participants vs learners who paid for the verified track, MIT and Harvard courses, 2017–18
That's from Reich and Ruipérez-Valiente's 2019 Science paper on MIT and Harvard edX courses. Completion among all participants fell from about 6% in 2014–15 to 3.13% in 2017–18.[2]
The "10–15%" range most likely comes from Katy Jordan's 2015 study of 221 MOOCs. Completion ranged from 0.7% to 52.1%, with a median of 12.6%. Longer courses had lower completion, and the first two weeks were critical for engagement.[1]
The "about 5%" figure is from Coursera's own 2012 data: roughly 5% of sign-ups earned a Statement of Accomplishment.[3]
All three describe free courses, most of them 8 to 14 years old. Using them to benchmark a paid program is like judging a gym by how many people walk past it.
Completion depends on who you count
A completion rate is a fraction, and the bottom of the fraction changes everything.
Registrants include people who clicked "enroll" and never came back. Starters opened at least one lesson. Intenders said they meant to finish. Same course, three different rates.
| Who you count | Completion rate |
|---|---|
| Everyone who enrolled | 30.02% |
| Everyone who started | 43.08% |
| Everyone who said they intended to finish | 48.13% |
Çelik and Çağıltay, Open Praxis, 2024: 15,805 enrollments across four MOOCs, 2018 data.
Those are from a 2024 study of four Turkish MOOCs.[5] The same course moved 18 points depending on the denominator.
Intent matters even more in the older data. In one Stanford course on Coursera, about 24% of students who said they intended to finish did so, against under 2% of other registrants.[3]
So before you compare your number to anyone's, ask what the bottom of their fraction was. Most published "completion rates" don't say.
What happens when people pay
Paid learners finish at much higher rates, in every dataset we found.
- edX verified track: 46% of paying learners completed in 2017–18, and 56% in 2016–17.[2]
- Coursera's first Signature Track class: 74% of students who paid $30 to $100 for a verified certificate finished, against 9% of those who didn't. That's one nutrition class from January 2013.[3]
- Coursera paid enrollments, 2016–2019: 55.4% average completion across 2,583 courses and about 5 million paid enrollments, with most courses between 43% and 69%.[6]
Now the honest part. Most of that gap is selection. Among highly committed students in the Signature Track class, payers finished at 96% and non-payers at 84%.[3] The price filtered for commitment. The stake added roughly 12 points on top.
Both effects work in your favor. A price brings in people who intend to finish, and it gives them a reason to keep going. Ray's version: free registrants aren't bought in, so "they could just blow it off. Like they blow off the gym session."
It shows up outside courses, too. In our experience, a free one-day in-person event shows 35–45% of registrants, a free three-day event 10–15%, and a paid VIP ticket in the $100–$297 range 85–90%. Same audience, different stake.
For paid, instructor-led cohorts of four to eight weeks, our target is 50–60% completion, against the 46% for paid verified edX learners. That's a target we hold, not a measured dataset.
Cohorts help, by less than the marketing says
Structure adds a smaller, real lift. On Ruzuku, across 27,156 courses and 1.31 million enrollments, scheduled cohort courses completed at 53.4%, against 41.9% for open-access self-paced and 42.9% for drip courses. Courses with lesson discussion enabled completed at 50.9% against 37.3% without, and courses with assessments at 59.1% against 42.4%.[7]
That's one platform's observational data, so it can't prove cause. It's still the best measured cohort comparison published. Structured paid programs report higher graduation rates: 2U and edX reported 73% for degree programs, 76% for boot camps and 90% for executive education in 2023, with no denominators disclosed.[8]
The catch: paying gets people to start, not to show up
Price buys commitment at the door. It doesn't buy attendance.
In DellaVigna and Malmendier's study of 7,752 members at three US health clubs, members on flat monthly contracts of more than $70 went 4.3 times a month. That works out to more than $17 a visit, when a $10 pass was available.[4] People paid for the version of themselves who would go.
The same holds for courses. Paying for a Coursera certificate raised engagement through a certificate effect of about 8–9% and a sunk-cost effect of about 17–20%, but the sunk-cost boost faded within a few weeks of payment.[9]
That's why a paid program still needs accountability built in: live calls, deadlines, a peer group and a fast first win. Hormozi's value equation is useful here. Shrinking the time before a buyer sees a result raises the value they feel, and a quick win in week one is the cheapest place to do it.
On the post-purchase training sequences we build, each video typically keeps about half the viewers of the one before. So the first lesson does most of the work, and the call to book goes right after it.
What actually raises completion (the randomized evidence)
This is where most completion articles stop citing anything. The experiments are mixed, and the pattern is useful.
Cheap nudges mostly fail at scale. Planning prompts in three HarvardX courses raised completion by 29% in a 2017 study.[10] When a larger preregistered trial tested self-regulation prompts on 269,169 students in 247 Harvard, MIT and Stanford MOOCs, the prompts lifted early engagement but not completion.[11]
Reminders can backfire. In a MOOC field experiment, telling learners how many peers had submitted raised on-time submission. A deadline reminder was counterproductive.[12]
Commitment and stakes work, at least for a while. In a Stanford statistics MOOC with 657 students, a digital commitment device made students 40% more likely to complete. Reminders had no significant effect.[13] In a randomized trial with 760 MOOC learners, a 100 RMB reward or loss raised homework submission by 12.8 percentage points, while 10 RMB did nothing measurable.[14]
The lesson for a coaching program: skip the reminder email sequence as your completion strategy. Ask people to commit to something specific, put something real at stake, and build the program so the first two weeks produce a win.
Community and membership retention: what's published
Community retention data is thinner than course data, and almost all of it comes from vendors.
What the best communities do is clearer than how long members stay. In Circle's 2024 creator benchmark, 93% of top-tier creator communities require a purchase and all of them run events. 59% of those creators report event attendance above 50%, against 33% of others.[15] On the paid community challenges we run, our target is live-call attendance above 50% of enrolled participants.
Churn figures don't line up, because nobody uses the same definition:
- Memberful reports average annual churn of 9.8% for the membership operators it tracks in Q3 2025, up from 8.4% a year earlier. It doesn't disclose the operator count.[16]
- Circle says average churn for its communities is 4.9%–7.4%, with no sample, period or formula.[17]
- Recurly calculates its benchmarks monthly on paid subscribers, excluding trials, and splits voluntary from involuntary churn.[18] Its network page shows a 4.99% median for education in July 2026, but labels the table annual.[19] Treat that figure with care until the unit is clear.
Gross versus net matters as well. Antenna's streaming data showed 5.3% gross monthly churn in September 2024, but 3.1% net after same-month resubscriptions.[20] That's streaming, not memberships. It shows how different one business can look depending on which number you quote.
We haven't found an independent, method-disclosed churn benchmark for paid coaching communities. Anyone quoting one should be able to tell you the sample, the period and the formula.
Numbers you'll see that have no source
Don't build a plan on these
- "Average online course completion is 10–20%" and "Coursera and edX are 5–15%." Repeated without citations. The closest real sources are Jordan's 12.6% median and Coursera's 2012 figure of about 5%.[1][3]
- "Cohort courses average 72%" and "microlearning completes at 80–90%." Published by a course platform with no data source.
- "Cohort courses complete at 75–90%." This traces to Maven's co-founder in a 2022 LinkedIn post, with no method,[22] and to an investor announcement saying more than 75%.[23] Harvard Business School Online states 90% across its courses, also with no method.[24] They're program claims, not benchmarks.
- "Students in a community are 16x more likely to finish." We couldn't trace this to a source we could open. It's usually linked to a single 2013 course, and the vendor white paper said to contain it no longer loads.
- Coursera's 2025 learner outcomes figures as a completion rate. That survey of 52,862 learners only included people who had already completed something, so it can't give one.[25]
How to measure your own
Your own numbers beat every figure above, as long as you define them first.
- Fix the denominator. Count buyers who started the program, by cohort start date. Report registrants separately if you want to, but never mix them.
- Define completion. Finished the last module, attended the final call, or hit the program's outcome. Pick one and keep it.
- Track week one and week two. Jordan's data and our own sequences agree: most drop-off happens early. If week-one activity is low, fix the first win before anything else.
- Split churn. Report monthly churn on paying members, with voluntary cancellations and failed payments shown separately.
- Tie it to revenue. Completion matters because finishers buy the next thing. Track the next purchase by cohort, and connect it to LTV and 30-day cash.
Completion is one rung of the ladder. To design the community that keeps members engaged, see how to build an online community that feeds your paid offers and our comparison of Skool, Circle and GoHighLevel. For how the next offer fits, see offer architecture, and for the full growth plan, the scaling roadmap. Or book a strategy call and we'll look at your numbers with you.
Frequently asked questions
Sources
- 1.Massive open online course completion rates revisited: assessment, length and attrition. Katy Jordan, International Review of Research in Open and Distributed Learning 16(3), 2015-06-19.
- 2.Study offers data to show MOOCs didn't achieve their goals. Inside Higher Ed, reporting Reich and Ruipérez-Valiente, Science, 2019-01-16.
- 3.Retention and intention in massive open online courses: in depth. Koller, Ng, Do and Chen, EDUCAUSE Review, 2013-06-03.
- 4.Paying not to go to the gym. DellaVigna and Malmendier, American Economic Review 96(3), 2006-05.
- 5.Uncovering MOOC completion: a comparative study of completion rates from different perspectives. Çelik and Çağıltay, Open Praxis, 2024-08-29.
- 6.Drivers of Quality in Online Learning. Coursera, 2020.
- 7.Cohort vs self-paced completion study. Ruzuku (Abe Crystal), 2026-09.
- 8.2023 Transparency & Outcomes Report. 2U / edX, 2024-12-13.
- 9.Effects of payment on user engagement in online courses. Goli, Chintagunta and Sriram, Journal of Marketing Research, 2021-09-30.
- 10.Planning prompts increase and forecast course completion in massive open online courses. Yeomans and Reich, LAK '17 (MIT DSpace), 2017-03-13.
- 11.Scaling up behavioral science interventions in online education. Kizilcec et al., PNAS 117(26), 2020-06-15.
- 12.Combating procrastination on massive online open courses via optimal calls to action. Huang, Zhang, Burtch, Li and Chen, Information Systems Research, 2021-06.
- 13.Can behavioral tools improve online student outcomes? Experimental evidence from a massive open online course. Ethan Patterson, Cornell eCommons, 2015-04-09.
- 14.How monetary incentives improve outcomes in MOOCs: evidence from a field experiment. Gong, Liu and Tang, Journal of Economic Behavior & Organization, 2021-09.
- 15.2024 Community Benchmark Report: Creators. Circle, 2024.
- 16.The State of Membership: Q3 2025. Memberful, 2025-10-14.
- 17.Community analytics guide. Circle Blog, 2025-07-16.
- 18.Subscriber benchmarks. Recurly Docs, accessed 2026-10-04.
- 19.Churn rate benchmarks. Recurly, 2026-07 (data).
- 20.2024 top subscription insights: net churn. Antenna, 2024-2025.
- 21.Negative Option Rule. Federal Trade Commission, 2026-03-13.
- 22.LinkedIn post on cohort-based course completion. Wes Kao (Maven co-founder), LinkedIn, 2022-09-13.
- 23.Investing in Maven. Andreessen Horowitz, 2024-10-04.
- 24.Corporate Solutions. Harvard Business School Online, accessed 2026-10-04 (undated).
- 25.2025 Learner Outcomes Report. Coursera, 2025.
Written by
Ray GillespieCo-Founder & COO
Ray runs day-to-day operations across every Victory engagement, building the systems, automations and AI-powered workflows that hold the machine together. He has overseen operations behind more than $120M in revenue.
Part of the guide: The 7-to-8-Figure Scaling Roadmap for Coaching, Info and Service Businesses