LTV:CAC and 30-Day Cash for Coaching and Info Businesses: The Numbers That Decide How Fast You Can Scale
LTV:CAC tells you whether a customer is worth buying. 30-day cash tells you how fast you can scale. How to measure both, with worked numbers.
 Ray GillespieCo-Founder & COO
Published 11 min read
On this page
Key takeaways
- LTV:CAC tells you whether a customer is worth acquiring. 30-day cash tells you how fast you can afford to acquire the next one.
- The 3:1 rule is a SaaS rule of thumb. Its author later said LTV:CAC ratios "are to be used, not believed."[1]
- Count CAC fully loaded, by offer and by channel: media buyer, creative, software, commissions and sales salaries, not just ad spend.
- Measure LTV as collected gross profit, not booked revenue. In our worked example, one program looks like 3.2:1 on booked revenue and 1.2x on 30-day cash.
- Our target is 30-day gross profit of at least 1.5x fully loaded CAC before raising spend. Processors also act on dispute ratios well before the card-network line.[2]
LTV:CAC tells you whether a customer is worth acquiring. 30-day cash tells you how fast you can afford to acquire the next one. For a coaching or info business, the second number matters first.
Measure the gross profit a customer pays you in their first 30 days against a fully loaded acquisition cost, by offer and by channel. Above 1x, growth starts paying for itself. Below 1x, you are financing growth with savings, credit or refunds you haven't seen yet.
Most advice on this topic comes from SaaS finance blogs. We couldn't find a published, method-disclosed LTV:CAC distribution for coaching or info businesses, so this article gives you the method and our own targets instead of a made-up average.
Two numbers, two jobs
LTV:CAC answers whether the business model works. If a customer is worth more over their lifetime than they cost to win, you have something worth scaling.
30-day cash answers whether you can scale it now. A customer can be worth $10,000 over three years and still bankrupt you if you pay for ads today and collect over a year.
Founders who track cost per lead but not what a customer is worth in month one tend to hit the same wall. The ads work, the leads come in, and the bank balance still goes down every time they raise spend.
So we track both, and we read them in order. Does the offer earn its keep over time? Then, how much of that arrives before the next ad invoice?
Where 3:1 comes from (and why it's not your rule)
The "LTV should be about three times CAC" rule traces to David Skok, a SaaS investor. His original guidance was that LTV should be about 3x CAC for a viable SaaS or other recurring revenue model, and that CAC should be recovered in under 12 months.[3] He notes the 12-month rule dates from 2011 capital conditions.[4]
He later walked part of it back. In 2017 he called introducing the LTV:CAC goal of 3 without saying when to calculate it "a significant mistake," and added that the ratios "are to be used, not believed."[1]
The rule also assumes revenue that recurs. SaaS can wait for payback because the subscription keeps billing. Aleph and Benchmarkit's 2026 report put the median B2B SaaS CAC payback at 16 months in 2025, with the top quartile at 6 months or less and the bottom at 24 or more.[5]
Median CAC payback for B2B SaaS in 2025. Top quartile: 6 months or less.
A coaching or info business usually can't wait 16 months. Revenue comes as a one-time sale, a payment plan or a handful of renewals, and the ad bill comes this week.
Other industries land elsewhere. First Page Sage's client data puts business consulting at 4:1 ($2,622 LTV against $656 CAC), ecommerce at 3:1 and higher education at 5:1.[6] It's agency data from 2019 to 2024, 74% B2B and 68% organic, and it doesn't say LTV is gross profit. It's context, not a coaching benchmark.
Alex Hormozi, whose client-financed acquisition idea we use below, treats 3:1 as a pattern he observed, not a law. Take that attitude. Use the ratio to sort offers, and use cash to decide spend.
Fully loaded CAC, by offer and channel
Hormozi's three levers for scaling are customer acquisition, lifetime value and cost of delivery, and he credits Dan Kennedy's idea that the business that can spend the most to acquire a customer wins. You can't spend the most if you don't know what a customer costs.
Fully loaded CAC includes every cost of winning a customer:
- Ad spend
- The media buyer
- Creative: design, editing, talent
- Software and messaging usage
- Setter and closer commissions
- Salaries of the people who sell
On the event funnels we run, usage across email, SMS, carrier fees and A2P registration runs 1.5 to 3x the platform plan fee in launch months. That's our experience, not an industry benchmark, and it's why the software line is never "just the subscription."
| Cost line | Month total |
|---|---|
| Ad spend | $30,000 |
| Media buyer | $3,000 |
| Creative | $2,500 |
| Software and messaging usage | $1,500 |
| Setter and closer commissions | $4,000 |
| Sales team salaries | $9,000 |
| Fully loaded total | $50,000 |
| New customers | 40 |
| Fully loaded CAC | $1,250 |
| Ad-spend-only CAC | $750 |
Made-up numbers to show the method. They aren't a client result or a benchmark.
Counting ad spend alone makes each customer look $500 cheaper than they are. The real cost is 67% higher.
Then split it. A webinar customer, an event customer and a cold-traffic customer have different CACs, different close rates and different payment behavior. A blended number hides the offer that's losing money inside the one that's winning.
LTV for coaching and info businesses is gross profit, not revenue
LTV built from contract value overstates what you earn. For a coaching or info business, build it from collected gross profit:
- Collected revenue, not booked. Subtract refunds, chargebacks and payments that never arrive.
- Minus delivery cost. Coaches, community managers, support, software seats.
- Plus the back end. Upsells, renewals, the next program. Count only what has actually sold.
There is no public margin benchmark for coaching. The nearest service-business figure we found is for agencies: Promethean's 2024 report puts average net margin at 15% since 2015, and 13% for agencies above 25 people.[8] That's agencies, not coaching, so use it only as a reminder that service businesses carry real delivery cost.
Measure churn the way platforms do. Recurly calculates churn monthly on paid subscribers, excludes trials, and splits voluntary from involuntary churn.[7] The split matters: a failed card is a billing problem, and a cancellation is an offer problem. They have different fixes.
Retention is the biggest long-run lever on LTV. Frederick Reichheld's Bain work argued that a 5% gain in retention can raise profit by 25% to 95%, using 1990s models across industries, so read it as "can," not "will."[9] For the evidence on how completion and community affect retention, see our course completion and community retention statistics.
30-day cash and client-financed acquisition
Hormozi calls it client-financed acquisition in $100M Leads and customer-financed acquisition in his Lost Chapters material. The idea is the same: the customer's first-month gross profit pays for acquiring them, so growth costs you nothing out of pocket.
Framework
The 30-day cash test
- Below 1x. The customer's first 30 days of gross profit don't cover their CAC. Every new customer is funded from savings, credit or investors.
- Around 1x. You're at breakeven. Your credit line becomes your ad budget, and one slow month stalls growth.
- 2x and above. Cash stops being the constraint. He treats about twice CAC plus the cost of fulfilling the customer as his real-life minimum.
Paraphrased from Alex Hormozi's client-financed acquisition (Hormozi, $100M Leads; Lost Chapters). Our reading of the ladder, not a quote.
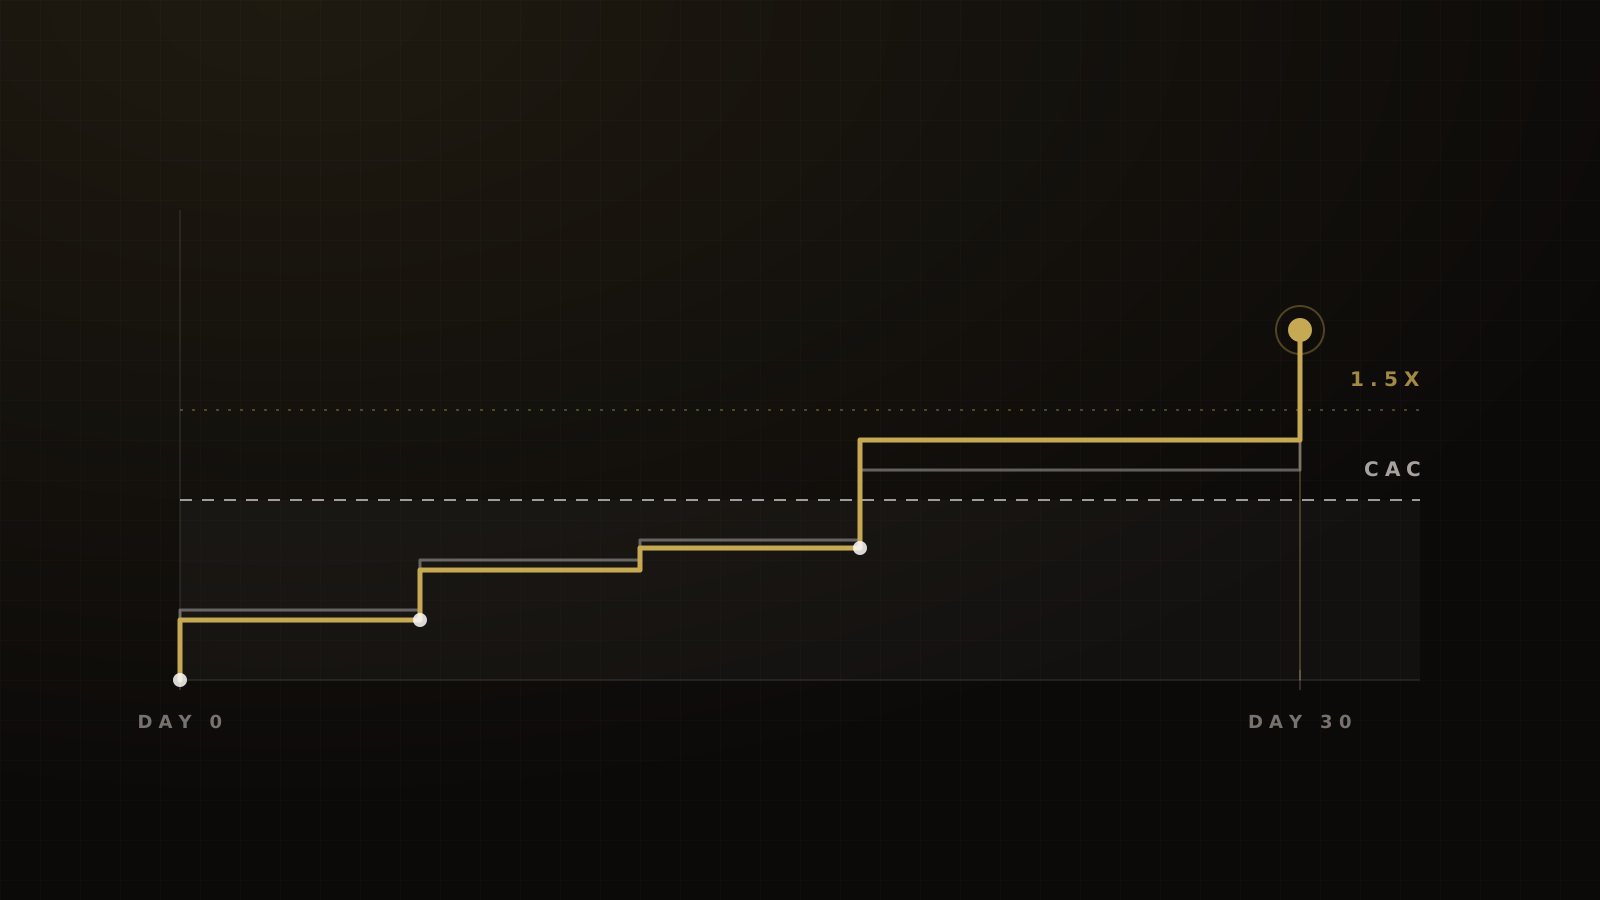
Our target sits between breakeven and his bar. Before we raise spend on a client funnel, we want 30-day gross profit of at least 1.5x fully loaded CAC. That's a target we hold, not a result we're reporting, and we may move it toward 2x as we gather cohorts.
Here's why it matters. Take the program from the CAC table above. It's a $4,000 program sold on a payment plan: $1,000 at the sale, then $1,000 on days 30, 60 and 90. Assume 10% of what's due is refunded or never collected, and delivery costs $1,200 per customer, $300 of it in the first 30 days.
| Measure | Math | Result |
|---|---|---|
| Booked LTV:CAC | $4,000 / $1,250 | 3.2:1 |
| Lifetime gross profit to CAC | ($4,000 x 0.9 - $1,200) / $1,250 | 1.9:1 |
| 30-day cash multiple | ($2,000 x 0.9 - $300) / $1,250 | 1.2x |
Made-up numbers. CAC is the $1,250 from the table above.
On booked revenue, the program passes the SaaS rule easily. On 30-day cash, it clears breakeven and misses our 1.5x target, so we wouldn't scale it yet.
Now change one thing. Move $500 of the plan to the front, so the sale collects $1,500 and the first installment on day 30 is still $1,000. The 30-day cash becomes ($2,500 x 0.9 - $300) / $1,250, or 1.6x. Same price, same customer, same ad cost. Only the timing moved.
That's the lever most info businesses miss. They work on the price and the funnel, and never on when the cash arrives. Besides collecting more up front, the other first-month levers are:
- A one-click upsell. Our target take rate is 8 to 12% on a sub-$100 front end. That's our rule of thumb, and we haven't found a coaching-specific benchmark to set beside it.
- An order bump on a free registration. In our experience, a paid bump on a free webinar registration recovers roughly 40 to 50% of the ad spend.
- A faster close. Every day between the sale and the first payment is a day you're financing the customer.
Why booked revenue lies
Booked revenue is a promise. Collected cash is what you can spend. Four things open the gap.
Payment plans and failed payments
Payment plans are material for experts selling online. Kajabi reports $544M moved through 3-payment plans, and 12-payment plans collecting 3.4M installments worth $444M, across 101M transactions from May 2015 to July 2026.[10] That tells you plans are common. It doesn't tell you what share of sales they are, or how many fail.
The nearest public default data is for consumer lenders, not merchants. The CFPB found that in 2023, 4.1% of pay-in-four loans from six large lenders were assessed a late fee and 1.83% were charged off.[11] That's a lender's outcome, so don't copy it into your model. We couldn't find a published default rate for merchant installment plans on coaching programs. Pull yours from your own payment processor.
Refunds and chargebacks
Refunds come out of the cash you counted, and they're hardest to see at the moment you decide to scale. A next-day kickoff for buyers is one of the cheapest ways we know to shrink them. We cover it in the acceleration session case.
Chargebacks add a ceiling. Visa flags US merchants as "Excessive" at a fraud and dispute ratio of 1.5% from April 2026, down from 2.2%, once there are at least 1,500 monthly cases. It flags acquirer portfolios at 0.5% and 0.7%, so processors police merchants well under the merchant line.[2] Stripe's documentation of Mastercard's program puts its first excessive tier at 100 to 299 chargebacks and a 1.5% to 2.99% chargeback rate in a month.[12] Our target on event sales with a next-day kickoff is a dispute ratio under 0.5% of transactions.
Event deposits and timing
If you sell events, you pay for the venue, the speakers and the ads before the event happens. The ticket cash and the VIP upgrades arrive over weeks. The 30-day view has to include those costs on the day they leave your account, not when the event is recognized as revenue.
The cash buffer you actually have
Run a 13-week cash view alongside the multiples: one row per week, collected cash in, costs out. The point is to see a dip before you hit it.
Small businesses don't have much room. In the Federal Reserve's 2026 survey, 54% of employer firms reported trouble paying operating expenses and 50% reported uneven cash flow, which includes collecting receivables.[13] JPMorganChase Institute found the median small business held 17.6 days of cash buffer in 2025.[14] Neither figure is specific to coaching. But a buffer under 18 days is shorter than the 30 days this article is about.
What to do this week
Your 30-day cash scorecard
- Fully loaded CAC for your top offer and your top channel. Include sales salaries and commissions.
- Collected, not booked. The cash that actually hit the account in each customer's first 30 days.
- First-month delivery cost per customer.
- 30-day cash multiple = first-month gross profit divided by fully loaded CAC. Set your own bar; ours is 1.5x.
- Refund and dispute rates by purchase cohort, not by calendar month.
- A 13-week cash view that includes event costs and installment dates.
If you don't know which constraint to fix first, our scaling stage diagnostic helps you find it. For what tends to break as spend grows, read fix what breaks at scale. The structure of the offer decides how much cash arrives early, so it's worth reading offer architecture alongside this. The wider plan is in the scaling roadmap.
If you'd like us to pressure-test your own numbers, book a strategy call. Bring your CAC lines and your last three months of collected cash, and we'll work out the multiple together.
Frequently asked questions
Sources
- 1.LTV:CAC. David Skok, For Entrepreneurs, 2017-06-28.
- 2.Visa Acquirer Monitoring Program (VAMP) fact sheet. Visa, 2025.
- 3.Startup Killer: the cost of customer acquisition. David Skok, For Entrepreneurs, c. 2009 (page undated).
- 4.SaaS Metrics 2.0: a guide to measuring and improving what matters. David Skok, For Entrepreneurs, 2013 (updated).
- 5.CAC payback period benchmarks for SaaS, 2026. Aleph x Benchmarkit, 2026-10.
- 6.The LTV to CAC ratio benchmark. First Page Sage, 2025-04-17.
- 7.Subscriber benchmarks. Recurly Docs, accessed 2026-10-04.
- 8.2024 Digital Agency Industry Report. Promethean Research, 2024-08.
- 9.Loyalty Rules!, chapter 1. Frederick Reichheld, Harvard Business School Press, via Bain, 2001.
- 10.What experts actually charge. Kajabi, 2026-08-05.
- 11.The Buy Now, Pay Later market. Consumer Financial Protection Bureau, 2025-12.
- 12.Dispute and fraud card monitoring programs. Stripe Documentation, accessed 2026-10-04.
- 13.2026 Report on Employer Firms. Federal Reserve Banks, Small Business Credit Survey, 2026-03-03.
- 14.San Francisco small business snapshot. JPMorganChase Institute, 2026-05-28.
Written by
Ray GillespieCo-Founder & COO
Ray runs day-to-day operations across every Victory engagement, building the systems, automations and AI-powered workflows that hold the machine together. He has overseen operations behind more than $120M in revenue.
Part of the guide: The 7-to-8-Figure Scaling Roadmap for Coaching, Info and Service Businesses