The 7-to-8-Figure Scaling Roadmap for Coaching, Info and Service Businesses
Stuck between $1M and $10M? Find your stage, run the six-constraint test, read unit economics by offer and channel, and fix one constraint at a time.
 Ray GillespieCo-Founder & COO
Published 18 min read
On this page
- Why you're stuck at seven figures (it's one constraint, not everything)
- The map: Acquisition.com's ten stages, in plain English
- The six-constraint test
- Unit economics by offer and by channel
- Booked revenue lies: payment plans, refunds and deposits
- Stress-test before you scale spend
- Who to hire, and only when
- Keep the customers you paid for
- How we run this at Victory
- Common mistakes
Key takeaways
- A business between $1M and $10M rarely needs more of everything. It has one binding constraint at a time: demand, conversion, founder-led sales, delivery capacity, retention or cash timing.
- Use Acquisition.com's $100M Scaling Roadmap to place yourself by headcount, then use the six-constraint test to find what to fix inside that stage.[1]
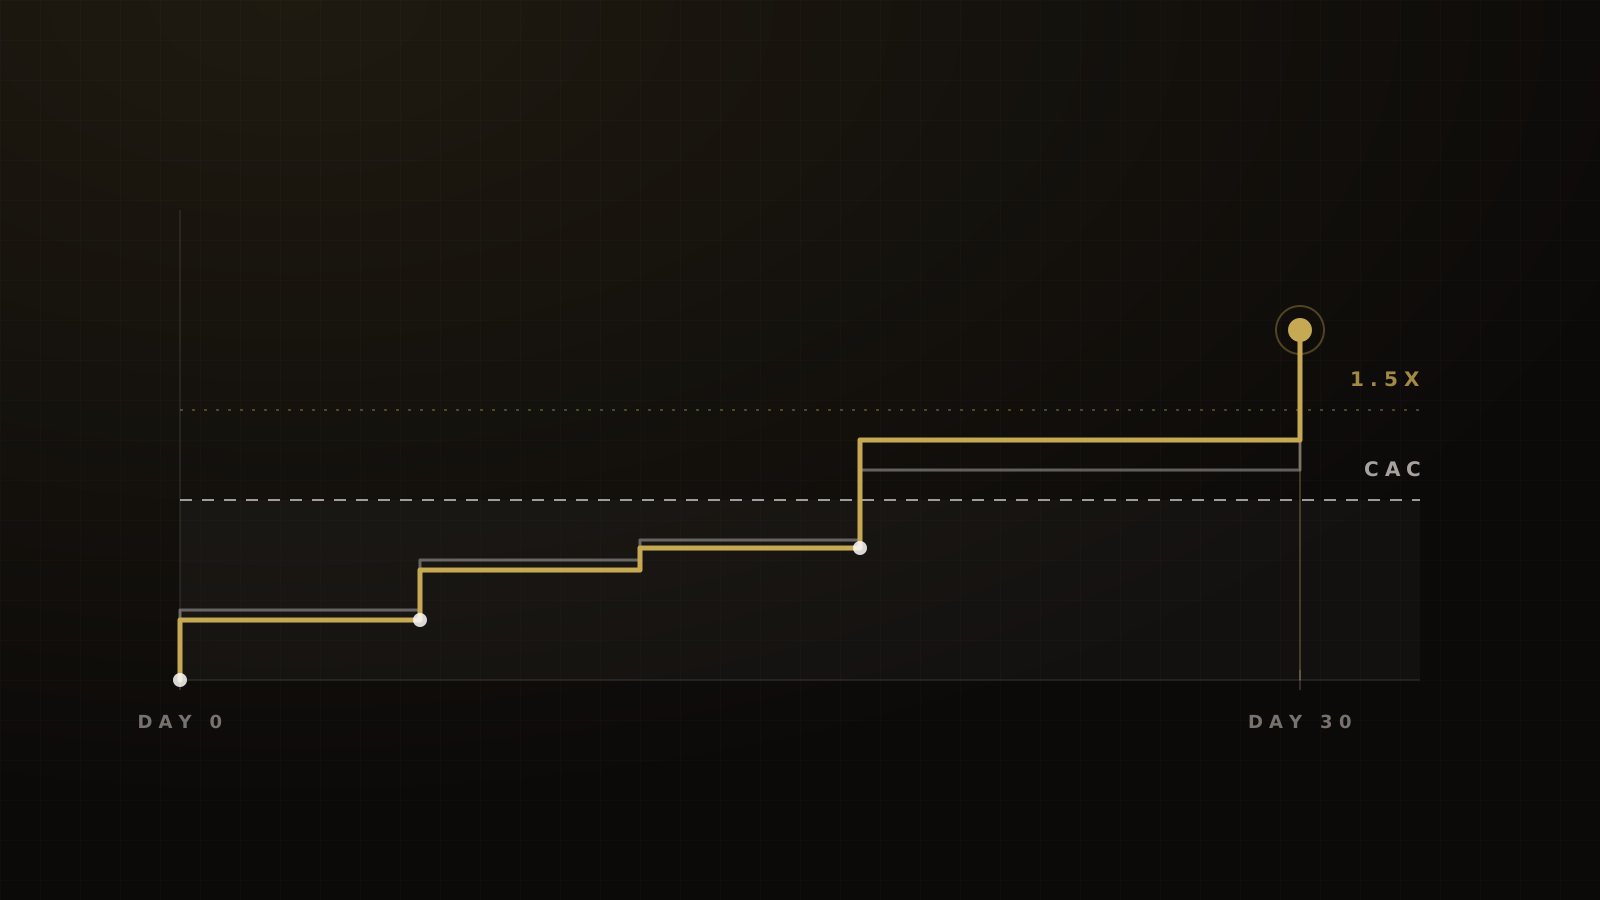
- Read unit economics by offer and by channel, on cash collected, not bookings. Our target before raising spend is 30-day gross profit of at least 1.5x fully loaded acquisition cost.
- Booked revenue lies. Payment plans, refunds, chargebacks and event deposits all open a gap between what you sold and what you can spend.
- Hire for the constraint you have, not the org chart you want. A closer can't fix a demand problem, and an agency can't fix a broken back end.
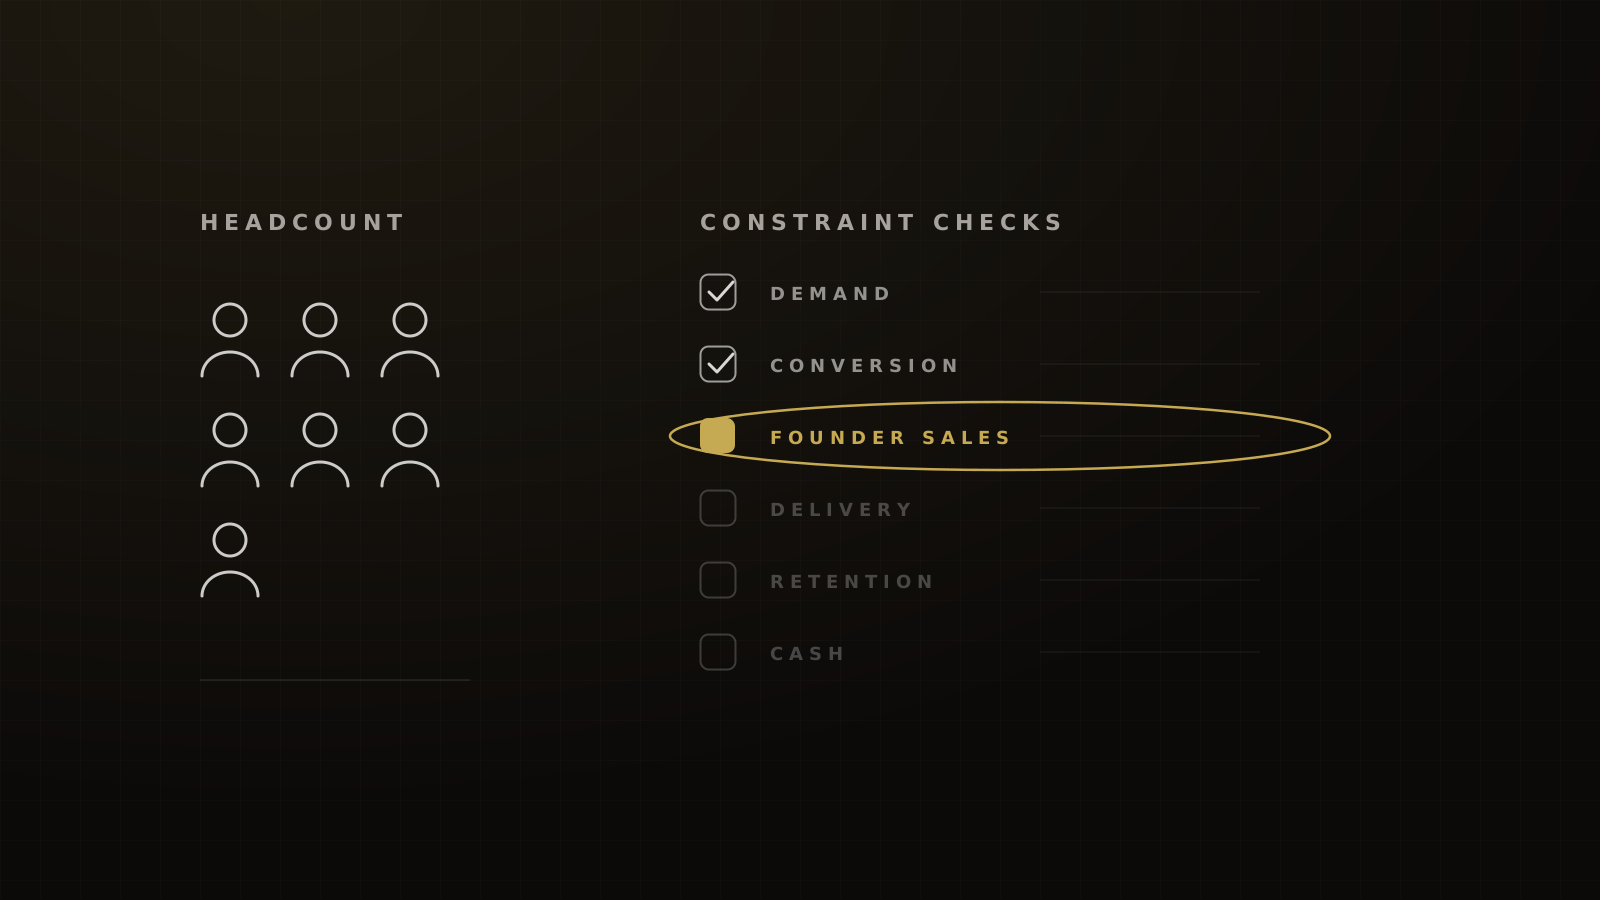
A business stuck between $1M and $10M almost never needs more of everything. It needs one thing fixed: the constraint that is binding right now. In our experience that constraint is one of six: demand, conversion, founder-led sales, delivery capacity, retention or cash timing.
Find it with numbers by offer and by channel. Fix that one thing. Then measure again, because the constraint moves the moment you fix it.
Acquisition.com's $100M Scaling Roadmap tells you which stage you're in by headcount.[1] The six-constraint test tells you what to fix inside that stage. This guide covers both, plus the unit economics, the cash timing and the hiring order that sit underneath them.
Why you're stuck at seven figures (it's one constraint, not everything)
Most founders at this size describe several problems at once. Leads are too expensive. The team is stretched. Cash is tight even in good months. All of it feels urgent.
The data says that's normal. In the Federal Reserve's 2026 survey of US employer firms, 57% said reaching customers and growing sales was an operational challenge, and 46% said the same about hiring or keeping qualified staff.[2] Half reported uneven cash flow.[2] Firms tick several boxes because several things hurt.
But a list of complaints isn't a diagnosis. Most of those problems are downstream of one upstream break. Expensive leads are often a conversion problem. A stretched team is often a delivery-design problem. Tight cash is often a payment-terms problem.
Getting past the first million is also rarer than it feels from inside a founder group. In 2022, about 30.2% of US employer firms had receipts of $1M or more, and about 4.5% had $10M or more (our calculation from Census counts, employer firms only).[3] The space between those two numbers is where this guide lives.
Our view is simple: scaling a leaky funnel scales the leak. Ray's line for it inside Victory is "sharpening the axe before you chop down the tree." Every click that doesn't register, book or show up is money spent on a step that doesn't hold.
In our audits, the first constraint we fix is more often conversion than lead volume. Founders come in asking for more traffic. The numbers usually point at the page, the show rate or the close rate first.
The map: Acquisition.com's ten stages, in plain English
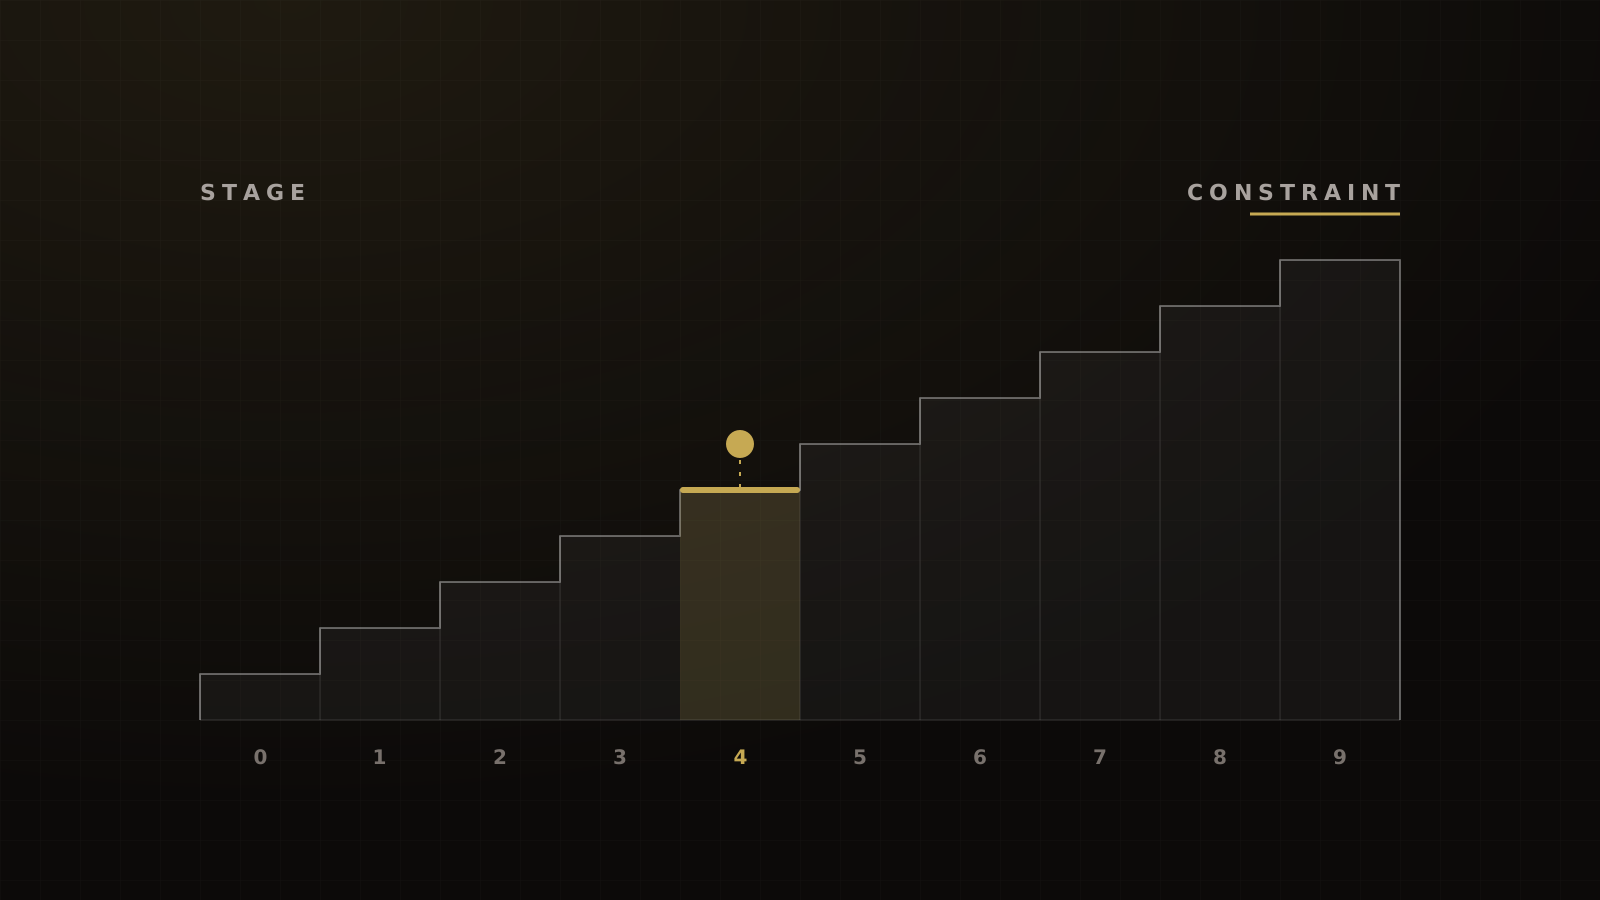
Acquisition.com publishes a free ten-stage Scaling Roadmap. It sorts businesses by headcount and pairs each stage with the constraint most likely to be binding there.[1] We use it as a map. Credit for the framework is Acquisition.com's; the plain-English summary below is ours.
| Stage | Headcount | What's usually binding |
|---|---|---|
| 0 Improvise | 0 to 1 | Nobody is using it yet |
| 1 Monetize | 0 to 1 | Nobody is paying yet |
| 2 Advertise | 0 to 1 | New customers arrive unevenly |
| 3 Stabilize | 1 to 4 | Too much work for the founder alone |
| 4 Prioritize | 5 to 9 | Serving everyone instead of the best customers |
| 5 Productize | 10 to 19 | Too little revenue per customer |
| 6 Optimize | 20 to 49 | Everything works, inefficiently |
| 7 Categorize | 50 to 99 | Every system is overloaded |
| 8 Specialize | 100 to 249 | No one person can know it all |
| 9 Capitalize | 250 to 500 | Unclear where the next growth comes from |
Stage names and headcount bands from Acquisition.com. The 'usual constraint' column is our paraphrase of the roadmap. Bands overlap at the low end, so solo founders should place themselves by what they've proven (a free user, a first sale, repeatable acquisition), not headcount alone.
Why headcount, not revenue
Revenue per head varies too much to be a useful ruler. A $3M coaching business with eight people and a $3M agency with thirty have very different problems. The eight-person firm is usually still fighting about focus. The thirty-person firm is fighting about process.
Headcount tracks complexity. Each new layer of people adds handoffs, and handoffs are where things break. That's why the roadmap's own product page frames it as solving the biggest constraint at your size.[4]
Where most $1M to $10M coaching and service firms sit
In our experience, most coaching, info and service businesses in this revenue band sit somewhere between stages 3 and 6. Lean, high-margin coaching businesses can pass $3M with a team that still fits stage 4. Done-for-you service firms often need stage-6 headcount to deliver the same revenue.
Treat that as a pattern, not a rule. Count the people who do the work, including full-time contractors, and place yourself honestly.
The idea isn't new. Churchill and Lewis's five-stage model in Harvard Business Review (1983) made the same core point: the owner's role has to change as the business gets more complex.[5] What got you here is what breaks next.
If you want a fast way to place yourself, our scaling stage diagnostic turns this into a checklist.
The six-constraint test
Inside any stage, the binding constraint is almost always one of six. Check them in this order, because each one hides the next. If demand is broken, you'll never see the conversion problem. If conversion is broken, you'll blame the closers.
1. Demand: are enough qualified people arriving?
Demand is the constraint when the funnel converts well but there isn't enough traffic of the right kind. Signs: opt-in and show rates are healthy, closers have open slots, and the ad account can't spend more without costs jumping.
Look at cost per qualified lead and volume by channel, not blended. When demand is solved, it looks like this. On a weekly evening webinar program we run, ads go live only in the two days before each session. Our best cost per registration there is $4 to $5, the lowest we've seen, and the program has returned 4 to 7x ad spend week over week. For context, LocaliQ puts the average Meta lead-campaign cost per lead at $27.39 across industries and $26.31 for education and instruction.[6] Different metric, same direction: when the offer and timing are right, demand stops being the constraint.
2. Conversion: opt-in, show and close
Conversion is the constraint when traffic arrives and leaks before it pays. It is the one founders most often misread as a demand problem.
A common pattern: the client says "the ads aren't working," and the opt-in page is converting 1% to 2% of cold clicks. That isn't an ads problem. On the funnels we run, cold Meta traffic to a generic opt-in page converts at 15% to 22%. Unbounce's 2024 benchmark puts Facebook-referred landing-page visitors at 13% across industries.[7]
Check show rate next. In our experience, a free one-day in-person event run well shows 35% to 45% of registrants, and booked high-ticket sales calls held within about three days of booking show 82% to 88%. RevenueHero's B2B data puts the average sales-meeting no-show rate at 15.9%.[8] If you're well below those, more traffic only buys more no-shows.
Then close rate. Measure it per closer and per lead source, not as one blended number.
3. Founder-led sales: does pipeline depend on one calendar?
This is the constraint when revenue rises and falls with the founder's availability. A vacation shows up in the revenue chart. Follow-up slips when the founder is delivering. Every handoff to a rep loses close rate.
Founder-led sales is normal at this size. SparkToro's 2026 agency survey found 70% of agencies had no full-time sales staff.[9] It only becomes the constraint when demand and conversion are fine and the calendar is full. The fix is a documented sales process and a closer, covered below.
4. Delivery capacity: can you serve what you sell?
Delivery is the constraint when onboarding queues grow, rework rises, coaches or account managers are over capacity, and new clients wait for their first win. Selling more makes it worse.
Professional-services firms give a useful reference point. SPI Research's 2026 benchmark, summarized by Deltek, found billable utilization fell to 66.4% in 2025, against the 75% SPI treats as optimal.[10] If your delivery team runs near or above full utilization, there's no slack for the clients you're about to sell.
5. Retention: do customers finish, renew, refer?
Retention is the constraint when acquisition works but customers don't stay, don't complete or don't come back. You have to replace a large share of revenue every month just to stand still.
Track four things separately, because they have different fixes:
- Voluntary churn: customers who choose to cancel.
- Failed-payment churn: cards that decline. Recurly's benchmarks split voluntary from involuntary churn for this reason.[11]
- Refunds and chargebacks: customers who want their money back.
- Program completion: customers who stop showing up before they get the result.
6. Cash timing: can you pay commitments before the money lands?
Cash timing is the constraint when the business is profitable on paper but can't fund the next month's ad spend, payroll or event deposits. It's common: 54% of employer firms in the Fed's survey reported trouble paying operating expenses.[2] We cover it in its own section below because it's the one that ends businesses.
Framework
The constraint loop
- Set the goal and the metric. Usually 30-day cash collected per month, not bookings.
- Find the binding constraint. Run the six checks in order. The first one that fails is the one.
- Get more out of it before you buy anything. Fix the page, the reminder, the script or the onboarding step before adding headcount or spend.
- Line everything else up behind it. Don't scale ads while the closers are full.
- Raise its capacity. Hire, build or spend, now that you know where.
- Re-run the checks. The constraint has moved. Start again.
Concept from Eliyahu Goldratt's Theory of Constraints; the 'do more until it breaks, then make it better' sequence is Hormozi's More, Better, New from $100M Leads. The loop is how we apply both.
TOCICO, the Theory of Constraints body, teaches the same sequence and starts it with a step zero: define the goal and how you'll measure it.[12] Hormozi's More, Better, New says the same thing in operator terms: do more of what works until it breaks, then make the broken step better before you try anything new.
Unit economics by offer and by channel
Blended numbers hide constraints. One profitable offer can carry a losing one for a year. One channel can look fine on average while the other burns cash.
So build the numbers for each offer, sold through each channel. A $997 course sold through checkout and a $6,000 program sold on a call are different businesses. So are cold Meta traffic and your own email list.
Fully loaded CAC
Hormozi's three levers are lower acquisition cost, raise lifetime gross profit and shorten payback. His first rule is to count acquisition cost fully. That means ads, the media buyer, creative, software, commissions and the sales team's salaries, not just ad spend.
Most founders we audit track cost per lead and stop. That number can look great while fully loaded cost per customer climbs.
30-day gross profit and client-financed acquisition
Hormozi's favorite metric is the gross profit you collect in a customer's first 30 days. In $100M Leads he calls the goal client financed acquisition: collect more in the first 30 days than it cost to acquire and serve the customer, so each customer funds the next. His Lost Chapters material calls it customer financed acquisition and sets 2x as his own real-world minimum.
Our target before raising spend on a client funnel is 30-day gross profit of at least 1.5x fully loaded acquisition cost. It's a target we hold, not a result we promise, and it's lower than Hormozi's 2x because many of the offers we work on also have a back end.
For low-ticket front ends, we're happy with less. Our target for a self-liquidating front end at scale is 0.8 to 1.2x return on ad spend, judged on the cost to acquire a back-end customer. There's no public industry benchmark for that; it's our working rule.
LTV:CAC 3:1 is a SaaS rule of thumb, not physics
The famous 3:1 lifetime value to acquisition cost ratio is David Skok's rule of thumb for SaaS businesses, alongside recovering acquisition cost in under 12 months.[13] Hormozi uses 3:1 too and labels it a personal observation, not a rule.
It's a decent sanity check. It's a poor scaling rule for a coaching business, because "lifetime" is a forecast and cash is not. A business can show 4:1 on paper and run out of money waiting for payment plans to clear. That's why we lead with 30-day cash. The longer version is in our guide to LTV:CAC and 30-day cash.
A worked example (illustration, not a client result)
One $6,000 program, sold through two channels. Half the buyers pay in full; half take three payments of $2,200. Every number below is made up to show the math.
| Line | Cold Meta webinar | House-list webinar |
|---|---|---|
| Average booked revenue per sale | $6,300 | $6,300 |
| Cash collected in first 30 days | $4,100 | $4,100 |
| Delivery cost in first 30 days | $600 | $600 |
| 30-day gross profit | $3,500 | $3,500 |
| Fully loaded CAC | $2,800 | $900 |
| 30-day cash multiple | 1.25x | 3.9x |
Hypothetical figures. Fully loaded CAC includes ad spend, media buying, creative, software, commissions and sales salaries allocated to each channel.
Booked revenue is identical. The scaling decision is not. The house list clears our 1.5x bar easily. The cold channel doesn't, so we wouldn't raise its spend until the funnel, the close rate or the payment mix moves. A blended view would average these to "fine" and hide the problem.
For margin context on the service side: Promethean Research found US digital agencies have averaged a 15% net margin since 2015, falling to 13% above 25 full-time staff.[14] There's no equivalent public benchmark for coaching businesses, so we don't quote one.
Booked revenue lies: payment plans, refunds and deposits
Bookings are what you sold. Cash is what you can spend. Between $1M and $10M, the gap between them is where most nasty surprises come from.
Four things open the gap:
- Payment plans. A $6,600 plan sale is $2,200 this month. If a meaningful share of plan buyers stop paying, the booked number was never real.
- Refunds. Money that arrives and leaves inside the refund window.
- Chargebacks. Refunds you didn't agree to, with fees and processor risk attached.
- Event and vendor deposits. Venues, travel and production get paid before the ticket revenue and the back-end sales arrive.
The Fed's survey found half of employer firms had uneven cash flow, which it defines to include collecting receivables.[2] JPMorganChase Institute data puts the median small business's cash buffer at 17.6 days of typical outflows in 2025.[15] A launch that books well but collects slowly can eat that buffer in one cycle.
Median cash buffer for US small businesses in 2025: how long typical outflows could be paid from cash if inflows stopped
Run a 13-week cash ledger
Keep a rolling 13-week view with four lines per week: cash in by source, committed cash out, planned ad spend, and ending balance. Put payment-plan installments in the week they're due, minus your realistic default rate. Put event deposits in the week you pay them, not the week of the event.
Then make one rule: no spend increase that takes any future week below your floor.
Watch the dispute ratio, not just refunds
Card networks watch disputes. Under Visa's monitoring program, a US merchant is classed as "excessive" at a 1.5% fraud-and-dispute ratio (with 1,500 or more such cases a month) from April 2026, and acquirers police their own portfolios at much lower levels.[16] A high-ticket launch with a bad week of remorse can put a processor relationship at risk.
Our target on event sales with a next-day kickoff for buyers is a dispute ratio under 0.5% of transactions. Starting fulfillment the day after the sale is the best lever we've found for it. The full play is in our acceleration session case.
Stress-test before you scale spend
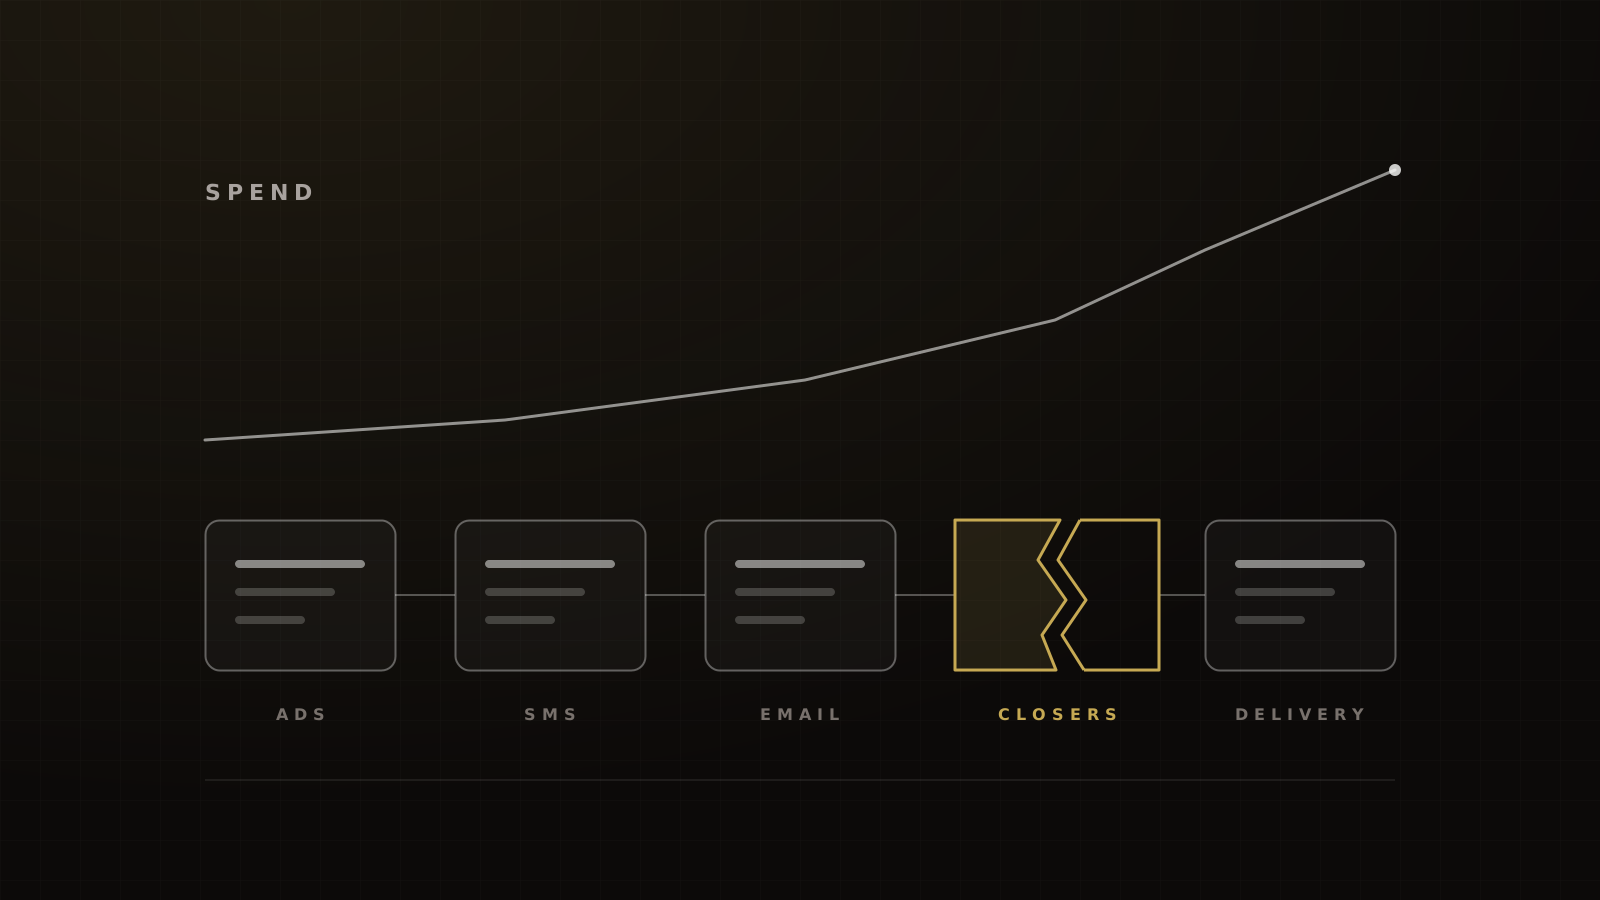
When spend goes up, the systems behind the ads take more load than they were built for. Reminder texts hit carrier limits. Email starts landing in spam. Closers' calendars overflow. Onboarding slips.
The systems that support the ad spend, they get stressed and they break.
So we break them on purpose, at small scale, before the budget goes up. Our stress test runs for 7 days at the planned daily spend on a capped audience, or until the campaign has about 50 optimization events. That matches Meta's own learning-phase exit, which comes after about 50 results in the week after the last significant edit.[17]
Timing matters as much as budget. On our weekly webinar program, running ads two weeks out instead of two days out raised cost per registration and lowered show rate. More time in market made the funnel worse, not better.
The full checklist (ad account, SMS, email, closer capacity, fulfillment and cash runway) is in what breaks at $1M, $3M and $10M.
Who to hire, and only when
The wrong hire at this size is expensive twice: once in salary, and again in the year you spend believing the problem is solved. Hire for the constraint you diagnosed.
| If the constraint is | Hire or buy | Don't hire yet |
|---|---|---|
| Demand | A marketing lead or an agency, with a learning goal and a deadline | A closer: they'll sit idle |
| Conversion | Funnel and CRO help; fix pages, reminders, scripts | More media buyers |
| Founder-led sales | A closer, once the sales process is written down | A sales manager with no reps to manage |
| Delivery capacity | A delivery lead and documented onboarding | Anyone in sales |
| Retention | One owner for customer success, with completion and refund targets | A community manager with no program to run |
| Cash timing | A finance lead or fractional controller with a 13-week ledger | More spend |
Our sequencing rule. Each hire assumes the constraints above it in the six-constraint test already pass.
Hiring closers
Our rule of thumb is to cap a closer's calendar at 75% to 80% of available slots. The remaining time goes to follow-up, which is where a lot of high-ticket deals actually close. Salesforce's 2026 State of Sales found sellers spend 40% of their time selling, which shows how quickly non-selling work fills a week.[18]
We add a setter only when closers' calendars are at 75% to 80% and more than about 20% of new leads are still uncalled after 24 hours. Before that, a setter is solving a problem you don't have.
Experienced closers ramp faster than most founders expect. In our experience, an experienced placed closer reaches a full call load in 2 to 4 weeks. For comparison, The Bridge Group's 2026 survey puts the average B2B account executive ramp at 6.2 months, in larger and more complex sales.[19]
For context on timing in venture-backed startups, Pave's data puts the first sales hire at around the ninth employee on average, with no sample size published.[20] Treat that as a curiosity, not a target. The trigger is the founder's calendar capping revenue, not a headcount number.
Hiring an agency
Hormozi's advice on agencies is to use one to learn a channel, with a purpose and a deadline, then bring the work in-house once your team can beat them. It's worth taking seriously, including when the agency is us. It fits demand problems well.
It fits less well when the constraint is the system between the click and the close, because that system isn't a channel you learn once. If you're comparing proposals, our breakdown of how growth agencies charge shows what each fee model rewards.
Keep the customers you paid for
Retention is the stage most scaling advice skips. It's also the cheapest place to find growth, because you've already paid to acquire the customer.
The famous retention statistic needs care. Frederick Reichheld wrote in Loyalty Rules! (2001) that a 5% increase in customer retention can increase profits by 25% to 95%.[21] That restated 1990s Bain models from industries like credit cards and insurance. The 1990 version of the claim said 25% to 85%.[22] And a 2001 Bain brief gave the figure as more than 25% in financial services.[23] The direction is right. The precise range is old and model-based.
What we measure instead is closer to the business:
- Live-call attendance in paid challenges. Our target is above 50% of enrolled participants. In Circle's 2024 creator benchmark, 59% of top-tier creators reported event attendance above 50%, against 33% of others.[24]
- Completion in paid cohort programs. Our target for a paid 4 to 8 week instructor-led cohort we build is 50% to 60%. For reference, paid verified learners in MIT and Harvard edX courses completed at 46% in 2017 to 2018, against 3.13% of all participants.[25]
- Refunds and disputes in the first 30 days, as above.
Two things move those numbers more than anything else in our experience: designed over-delivery and community. Over-delivery works when it's priced, not when it's unpaid overtime; we lay out the method in the business case for over-delivering. Community works when there's a free nucleus that feeds a paid space, covered in how to build an online community. Our own proof on community is still thin, and we say so in that guide.
The offer side matters too. A business with one offer has nothing to sell the customer who wants more. Our offer architecture guide covers how to build the next rung.
How we run this at Victory
If you want us to run the six checks on your numbers, book a strategy call. You'll leave with the constraint named and a prioritized plan, whether we work together or not.
Common mistakes
- Buying stage-9 solutions for a stage-3 problem. Enterprise software, a COO and a brand campaign won't fix a founder who is still the only closer.
- Hiring a closer for a demand problem. If calendars have open slots and leads are scarce, the closer has nothing to close.
- Raising spend before fixing show rate. Every no-show is ad spend you paid for twice.
- Judging by bookings. Payment plans, refunds and deposits make booked revenue look better than the cash you can spend.
- Fixing three things at once. You'll never know which one worked, and the constraint will move without you noticing.
- Reading blended numbers. One strong offer or channel can hide a losing one for a long time.
Frequently asked questions
Sources
- 1.The $100M Scaling Roadmap: stages by headcount. Acquisition.com, accessed 2026-10-04.
- 2.2026 Report on Employer Firms: Findings from the 2025 Small Business Credit Survey. Federal Reserve Banks, 2026-03-03.
- 3.2022 SUSB annual data tables by enterprise receipts size. US Census Bureau, 2022 data (released 2025).
- 4.Scaling Roadmap (product page). Acquisition.com, accessed 2026-10-04.
- 5.The Five Stages of Small Business Growth. Harvard Business Review (Neil C. Churchill, Virginia L. Lewis), 1983-05.
- 6.Facebook advertising benchmarks. LocaliQ / WordStream, 2026-09-23.
- 7.Conversion Benchmark Report. Unbounce, 2024-08-29.
- 8.Ways to reduce no-show rates in sales calls. RevenueHero, 2025-08-18.
- 9.Digital agency new business is still a concern, referrals still rule for lead gen. SparkToro, 2026-02-17.
- 10.Professional services benchmarks (summarizing SPI Research's 2026 PS Maturity Benchmark). Deltek, 2026-07-30.
- 11.Subscriber benchmarks. Recurly Docs, accessed 2026-10-04.
- 12.Introduction to the Theory of Constraints. TOCICO, accessed 2026-10-04.
- 13.Startup Killer: the cost of customer acquisition. David Skok, For Entrepreneurs, c. 2009.
- 14.2024 Digital Agency Industry Report. Promethean Research, 2024-08.
- 15.San Francisco small business snapshot (national median cash buffer days). JPMorganChase Institute, 2026-05-28.
- 16.Visa Acquirer Monitoring Program (VAMP) fact sheet. Visa, 2025 (thresholds effective 2025-06-01).
- 17.About the learning phase. Meta Business Help Center, accessed 2026-10-04.
- 18.State of Sales report, 7th edition. Salesforce, 2026-02-03.
- 19.AE Models, Motions & Metrics, 10th edition. The Bridge Group, 2026-06-22.
- 20.Who to hire first: the data behind team building. Pave, 2021-11-17.
- 21.Loyalty Rules!, chapter one. Frederick Reichheld, Harvard Business School Press (via Bain & Company), 2001.
- 22.The elasticity of customer value to retention: the duration of a customer relationship. Pfeifer & Farris, Journal of Interactive Marketing 18(2), 2004-05.
- 23.Prescription for cutting costs. Bain & Company (Fred Reichheld), 2001.
- 24.2024 Community Benchmark Report: Creators. Circle, 2024.
- 25.Study offers data to show MOOCs didn't achieve their goals (reporting Reich and Ruipérez-Valiente, Science). Inside Higher Ed, 2019-01-16.
Written by
Ray GillespieCo-Founder & COO
Ray runs day-to-day operations across every Victory engagement, building the systems, automations and AI-powered workflows that hold the machine together. He has overseen operations behind more than $120M in revenue.