Facebook Ads Benchmarks for Coaches and Education Offers (2026): CPL, CTR, CPC and CPM Trends
2026 Facebook lead costs for education offers, with method notes, Meta's price trend, and the funnel costs no table publishes: registration, show, call.
 Marius BulaiCMO & Head of Paid Media
Published 8 min read
On this page
Key takeaways
- In 2026, a Facebook lead for an education offer costs about $26 on average: LocaliQ's Education and Instruction figure is $26.31, down from WordStream's 2025 median of $28.22.[1][2]
- Education converts on lead forms better than any other category (15.87%), but its CTR is among the lowest.[1]
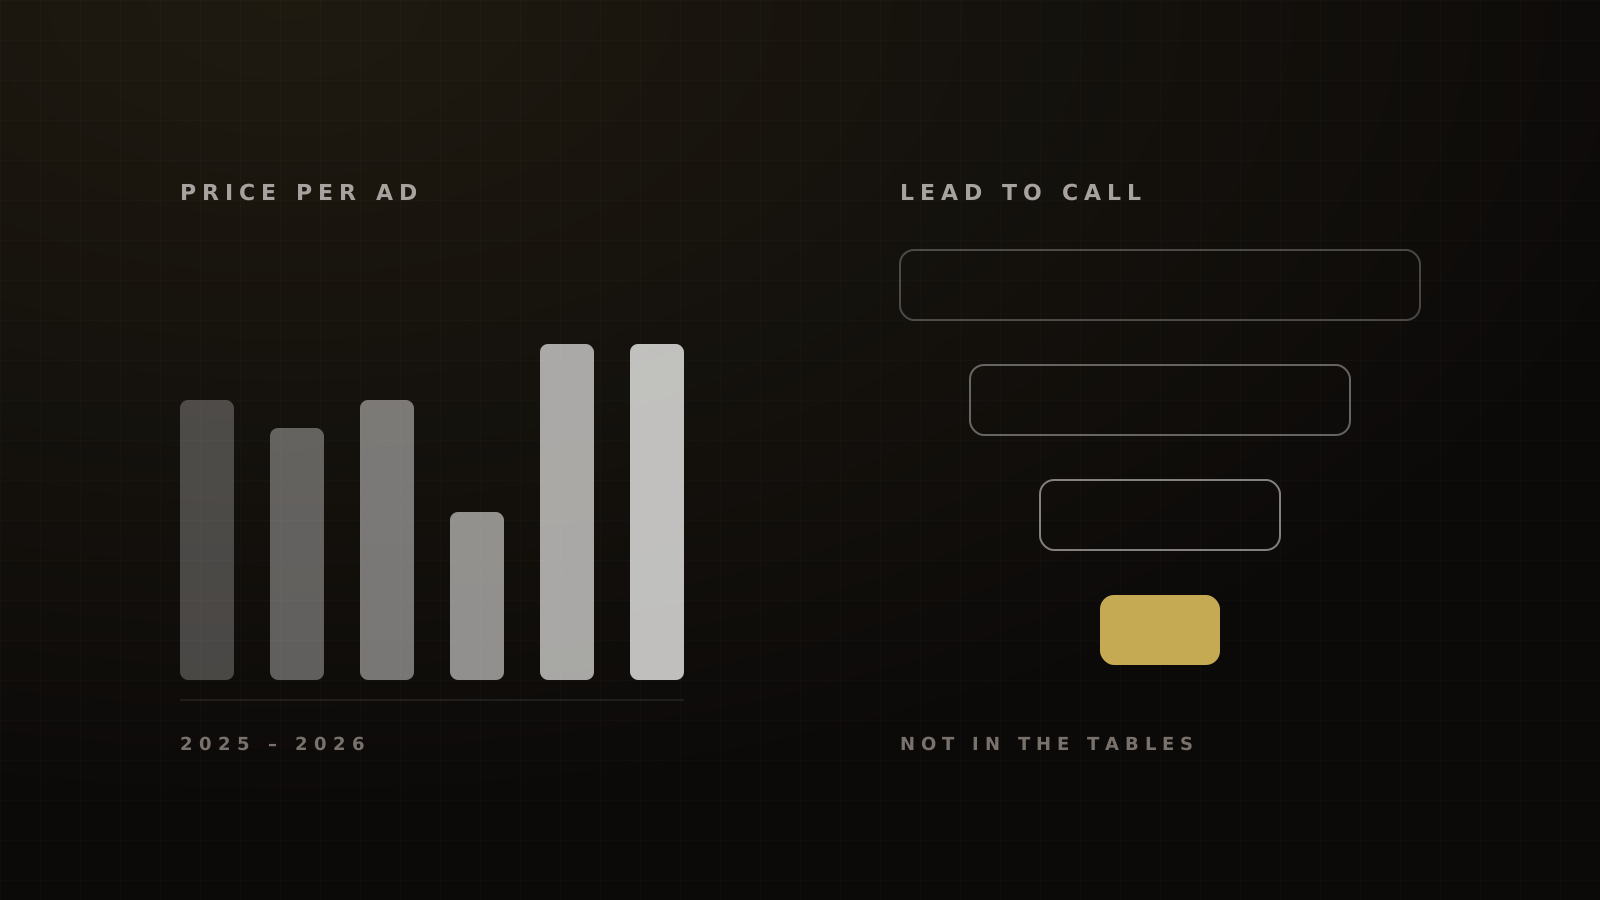
- Meta's own average price per ad rose 12% year over year in both Q1 and Q2 2026. Expect to pay more each year for the same reach.[3][4]
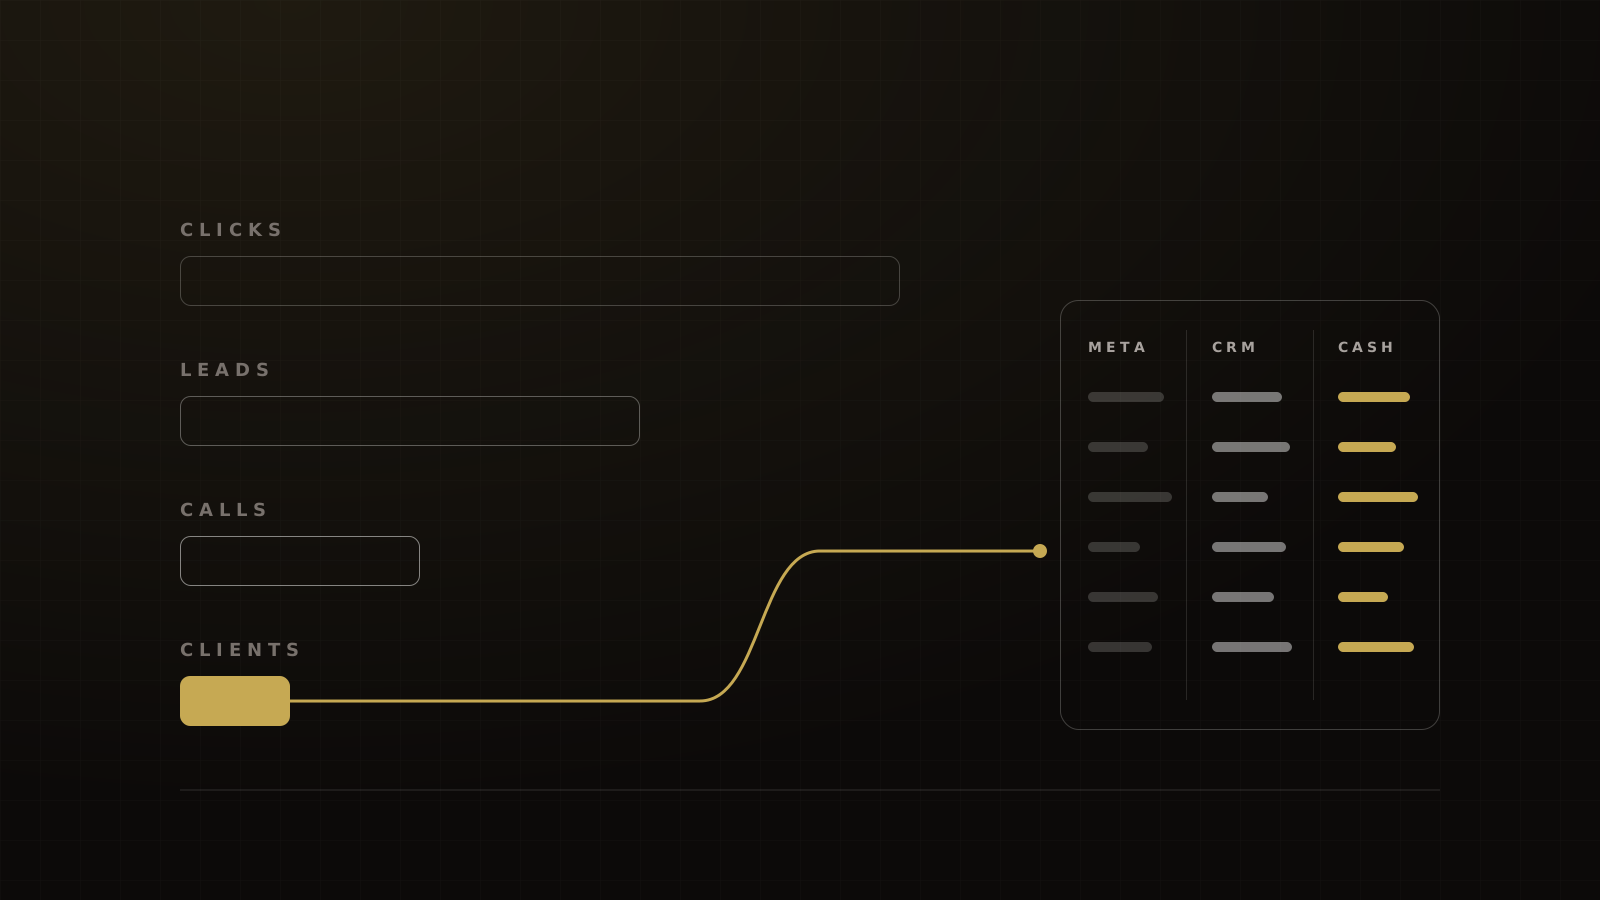
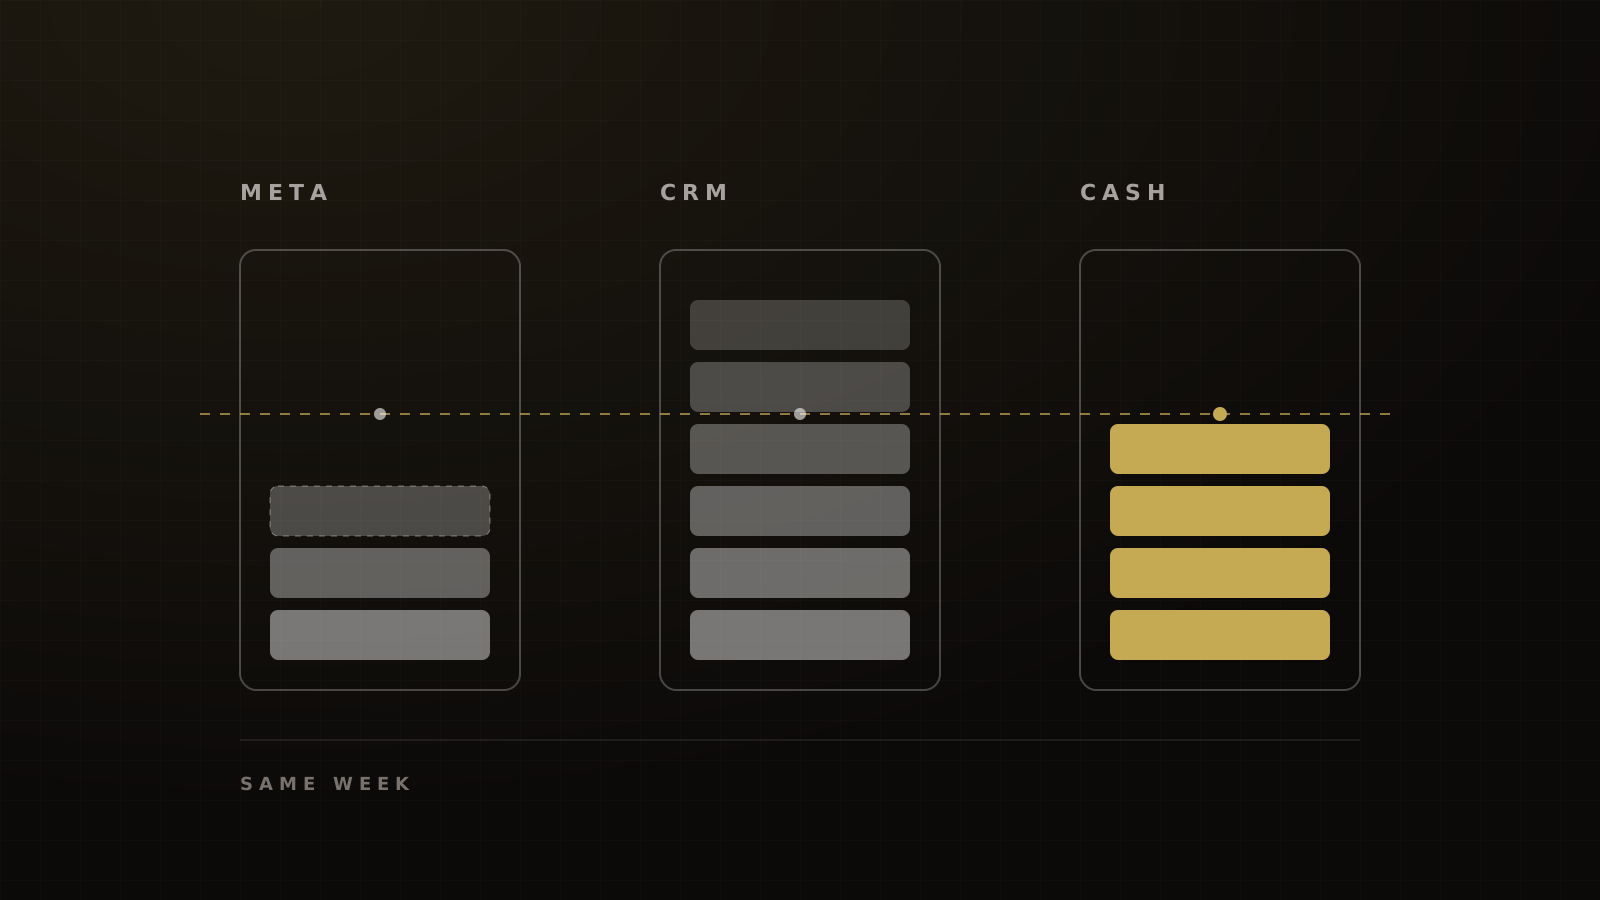
- No public benchmark gives cost per webinar registration, per live attendee, per booked call or per show. Those decide profit, and that's where your own data has to come in.
- Our best weekly webinar program runs at $4 to $5 per registration, against that $26 education average.
A Facebook lead for an education or coaching offer costs about $26 in 2026, CTR runs under 2%, and Meta's average price per ad rose 9% across 2025 and 12% in each of the first two quarters of 2026. Those are the defensible numbers.
The more useful numbers are the ones nobody publishes: what you pay per registration, per person who shows up, and per sales call that actually happens. We cover both below, with a method note on every source.
The 2026 numbers at a glance
| Metric | 2025 (WordStream) | 2026 (LocaliQ) |
|---|---|---|
| Cost per lead | $28.22 | $26.31 |
| Conversion rate | 10.08% | 15.87% |
| Click-through rate | 1.86% | 1.74% |
| Cost per click | $1.65 | $1.72 |
2025: WordStream, medians from 1,180 campaigns, April 2024 to June 2025. 2026: LocaliQ, labeled averages, with no sample, period or method disclosed. The two years aren't strictly comparable.
Sources: WordStream's 2025 report[2] and LocaliQ's 2026 page.[1] WordStream's chart shows 10.08% for conversion rate and its text says 10.05%; we use the chart.
Lead-campaign benchmarks for education and coaching
Education sits close to the all-industry average on cost per lead, and far above it on conversion rate.
| Category | CPL | Conversion rate | CTR |
|---|---|---|---|
| All industries | $27.39 | 8.54% | 2.70% |
| Education and Instruction | $26.31 | 15.87% | 1.74% |
| Health and Fitness | $27.11 | n/a | n/a |
| Personal Services | $38.09 | n/a | n/a |
LocaliQ 2026 averages. Adjacent categories show how wide the spread is.
All figures are from LocaliQ.[1] Personal Services rose from a $30.57 median in WordStream's 2025 report.[2]
What the 15.87% conversion rate really means. Lead campaigns mix Instant Forms with landing pages, and Instant Forms convert far more easily. Meta's own A/B test found campaigns using "website and instant forms" had 14.8% to 24% lower cost per lead than website-only campaigns.[5] That's raw cost per lead, not lead quality. Meta's default "More volume" form type is built for quick mobile submits, while "Higher intent" adds a review step to deter marginal interest.[6] An Instant Form CPL and a landing-page CPL aren't the same benchmark.
Other 2026 education figures, each with its own method:
- Focus Digital: $34.85 spend-weighted CPL from 138 North American campaigns, March to June 2026.[7]
- Superads: an education campaign-median CPL averaging about $21.31 from July 2025 to July 2026, all countries.[8]
- Triple Whale: a $26.80 median cost per purchase for e-learning and online courses across 40,000+ brands. That's a purchase metric, not a lead.[9]
Read education CPL as a range of roughly $21 to $35 across four sources, not one average. On the funnels we run, cold Meta CPL for a curiosity-led event opt-in typically lands at $15 to $25, below LocaliQ's $27.39 all-industry figure.
Traffic-campaign benchmarks
Education has one of the lowest CTRs on traffic campaigns too.
| Segment | 2025 CTR | 2025 CPC | 2026 CTR | 2026 CPC |
|---|---|---|---|---|
| Education and Instruction | 1.45% | $0.86 | 1.50% | $0.70 |
| All industries | 1.71% | $0.70 | 1.93% | $0.60 |
2025: WordStream medians. 2026: LocaliQ averages.
Sources: WordStream[2] and LocaliQ.[1] On a working webinar or event ad, we typically see cold link CTR of 1.8% to 2.5%, against LocaliQ's 1.74% for education lead campaigns. CTR is only a health check, though. The more direct the ad, the fewer clicks it gets, and the better those clickers tend to buy. Our event ad creative guide covers why.
What changed from 2025 to 2026
Education CPL fell about 7%, from $28.22 to $26.31, and conversion rate jumped from 10.08% to 15.87%.[2][1] Before you celebrate, note three caveats:
- Different statistics. 2025 is a median and 2026 is labeled an average.
- Unknown sample. LocaliQ's 2026 page discloses no sample size, date range or method. WordStream's 2025 PDF says 1,180 campaigns. A widely quoted "554 + 726" split adds to 1,280, which doesn't match.
- Seasonality inside the year. Superads shows education CPL peaking at $29.61 in February 2026 and falling to $14.72 in July 2026.[8] A year-over-year comparison can hide a swing that size.
Meta's own price trend: +9% to +12% a year
The most reliable cost trend comes from Meta's earnings releases. It's company-wide price per ad, not your CPM, but it's audited and it's dated.
| Quarter | Price per ad | Ad impressions |
|---|---|---|
| Q1 2025 | +10% | +5% |
| Q2 2025 | +9% | +11% |
| Q3 2025 | +10% | +14% |
| Q4 2025 | +6% | +18% |
| Q1 2026 | +12% | +19% |
| Q2 2026 | +12% | +14% |
Meta Platforms quarterly earnings, SEC exhibit 99.1. Company-wide, all advertisers.
Sources: Meta's exhibits for Q1 2025,[10] Q2 2025,[11] Q3 2025,[12] Q4 2025 (full year +9%),[13] Q1 2026[3] and Q2 2026.[4] Q3 2026 results are due in late October.
CPM trackers fill in the detail, with partial methods:
- Tinuiti, Q2 2026: Meta CPM up 10% year over year, Facebook up 13%, Instagram flat, across mostly retail clients. We read it through a public summary; the full report is gated.[14]
- Superads: median Facebook CPM went from $18.86 in July 2025 to a $24.26 peak in November 2025, then fell to $16.47 in July 2026.[15]
- Triple Whale: all-category median CPM of $15.06, up 13.24% year over year, August 2025 to July 2026.[9]
Seasonality is real, but not a law. Gupta Media measured an average CPM of $13.42 in Black Friday week 2024 and $17.70 on Cyber Monday, then $8.27 in January 2025.[16] Yet Tinuiti found Meta CPM down 7% year over year in Q4 2025, with Facebook down 13%.[17] November costs more than October. It doesn't always cost more than last November.
What the benchmarks leave out
Every table above stops at the lead. A coaching or event business makes money three or four steps later.
Cost per registration and cost per live attendee
No method-disclosed dataset publishes cost per webinar registration. The one public example we'd use is a single US education client that paid $8.06 and $12.96 per registration across two live webinars. That's one agency case study, not a benchmark.[18]
In our experience, a first cold-traffic webinar test lands at $12 to $20 per registration before optimization, well under WordStream's $28.22 education lead median. If you buy clicks instead, the page decides the cost. Cold Meta traffic converts at 15% to 22% on a generic opt-in page in our accounts, against 13% for Facebook-referred visitors in Unbounce's data.[19] On a webinar or event registration page we see 22% to 30%, against GetResponse's 22.3% for pages promoting a webinar.[20]
Then divide by show rate. On cold traffic, our single-date evening webinars show 25% to 35% live. Demio's 2023 data put Education Services at 20% and hosts under $1M in revenue at 22%.[21] The higher published rates, such as Goldcast's 40%,[22] Livestorm's 47.7%[23] and Univid's 49%,[24] are mostly B2B and house-list registrants; on a warm list we see 40% to 50% too.
Framework
Cost per live attendee (illustration)
- Cost per registration: $26.31, the 2026 education lead average.
- Live show rate: 30%, the middle of our cold-traffic range.
- Cost per live attendee: $26.31 ÷ 0.30 = $87.70.
- Same math at our tuned best: $4.50 ÷ 0.30 = $15 per live attendee.
Illustrative math, not a client result. Claude Hopkins' rule applies: judge an ad by what each customer costs, not by the replies.
Cost per booked call and cost per show
No public dataset covers cost per booked high-ticket call either. Calculate it as ad spend divided by booked calls, then divide again by the call show rate.
On the funnels we run, booked high-ticket calls held within about three days of booking show at 82% to 88%. RevenueHero's B2B average no-show is 15.9%, a median of 13.5%.[25] For live events, our free one-day events show 35% to 45% of registrants and paid VIP tickets 85% to 90%; PheedLoop's 2026 data puts the median paid-event no-show at about 17%.[26] A free in-person event registration from Meta costs us $18 to $24, against LocaliQ's $26.31 for education and $14.59 for arts and entertainment.[1]
Our webinar program as a reference point
| Metric | Education average | Our webinar programs |
|---|---|---|
| Cost per registration or lead | $26.31 (LocaliQ 2026) | $4–5 today; $8–10 was our best for years |
| Ad window | n/a | The 2 days before the webinar |
| Return on ad spend | n/a | 4–7x, week over week |
Victory figures are from our own programs, not a dataset. Industry figures are lead-campaign CPLs, a related but different metric.
The program is a weekly evening webinar. Ads run only in the two days before each session, at a few thousand dollars a day. In our experience, running ads two weeks out raises CPL and lowers show rate. The short window does both jobs at once.
Numbers to stop repeating
- "You have 1.7 seconds to hook them." That's Facebook IQ's average time spent with a mobile feed item, from video ads measured in 2014 and 2015 (2.5 seconds on desktop). It's a dwell time, not a deadline.[27]
- "The average Facebook CTR is 0.9%." That comes from WordStream's 2017 study of 256 accounts and $553,000 in spend, from late 2016.[28] Current tables put education between 1.45% and 1.86%, depending on objective and year.[2][1]
- Old ATT opt-in rates. Adjust measured 35% opt-in among users shown Apple's prompt in Q2 2025, and 14% for education apps.[29] That's app consent, not the share of your website leads Meta can't see.
- "The average CPM is $X" with no source, sample or date. Skip it.
How to use these benchmarks
- Compare like with like: same objective, same form type, same season.
- Use your own last 90 days as the primary benchmark, and the tables as a sanity check.
- Judge on the cost of a customer, not a lead. Hopkins' keyed-ad rule and Alex Hormozi's LTGP-to-CAC ratio say the same thing: what you can pay for a lead depends on what a customer is worth.
- Track the funnel costs no table publishes: cost per registration, per live attendee, per booked call and per show. Our Meta ads KPI scorecard lays them out, and the Meta ads budget calculator turns them into a spend plan.
Want to know whether your costs are a problem or just the market? Book a strategy call and we'll audit the funnel against these numbers.
Frequently asked questions
Sources
- 1.Facebook advertising benchmarks. LocaliQ, 2026-09-23.
- 2.Facebook Ads Benchmarks 2025 (PDF). WordStream by LocaliQ, 2025-09.
- 3.Meta reports first quarter 2026 results (exhibit 99.1). Meta Platforms, SEC filing, 2026-04-29.
- 4.Meta reports second quarter 2026 results (exhibit 99.1). Meta Platforms, SEC filing, 2026-07-29.
- 5.Capture every lead: website and instant forms. Meta for Business, undated page, test 2024-11-09 to 2024-12-09, checked 2026-10-04.
- 6.About instant form types: more volume and higher intent. Meta Business Help Center, living doc, checked 2026-10-04.
- 7.Average cost per lead on Facebook: July 2026 report. Focus Digital, 2026-08-21.
- 8.Facebook ads cost per lead: education. Superads, undated, checked 2026-10-04.
- 9.Facebook ads benchmarks. Triple Whale, 2026-08-18.
- 10.Meta reports first quarter 2025 results (exhibit 99.1). Meta Platforms, SEC filing, 2025-04-30.
- 11.Meta reports second quarter 2025 results (exhibit 99.1). Meta Platforms, SEC filing, 2025-07-30.
- 12.Meta reports third quarter 2025 results (exhibit 99.1). Meta Platforms, SEC filing, 2025-10-29.
- 13.Meta reports fourth quarter and full year 2025 results (exhibit 99.1). Meta Platforms, SEC filing, 2026-01-28.
- 14.Digital ads benchmark report by Tinuiti, Q2 2026: key highlights. Karooya, summarizing Tinuiti, 2026-08-11.
- 15.Facebook ads costs: CPM. Superads, living page, checked 2026-10-04.
- 16.Social media ads cost: CPM tracker. Gupta Media, 2024-10-17, updated with 2025 data.
- 17.Digital Ads Benchmark Report Q4 2025. Tinuiti, 2026-01.
- 18.Meta ads lead generation: webinar registration case study. RapidDev, undated, checked 2026-10-04.
- 19.Conversion Benchmark Report. Unbounce, 2024-08-29.
- 20.Email marketing benchmarks. GetResponse, 2024.
- 21.Webinar Statistics 2024. Banzai (Demio), 2024-01.
- 22.2026 B2B Webinar Benchmark Report. Goldcast, 2026.
- 23.Webinar Benchmark Report 2026. Livestorm, 2026-09-01.
- 24.Webinar statistics 2026. Univid, updated 2026-09-04.
- 25.Ways to reduce no-show rates in sales calls. RevenueHero, undated, checked 2026-10-04.
- 26.Event Data Lab #05: no-show rates by ticket type and event size. PheedLoop, 2026-04-29.
- 27.Capturing attention in feed: the science behind effective video creative. Meta (Facebook IQ), c. 2016.
- 28.Facebook advertising benchmarks for your industry. WordStream, 2017-02-28.
- 29.ATT opt-in rates in 2025. Adjust, 2025-07-15.
Written by
Marius BulaiCMO & Head of Paid Media
Marius runs all paid media strategy and execution at Victory. Before Victory he was Head of Analytics at Hyros, inside the data of some of the largest ad accounts in the world.
Part of the guide: Paid Ads for Coaches, Course Creators and Event Businesses: Meta, Creative and Attribution Tied to Cash