Meta Ads Budget Calculator: How Much Should a Coach Spend on Facebook Ads?
Work backward from what a client is worth: allowable CPA, show rate, front-end recovery, a pessimistic case and a test length tied to Meta's learning.
 Marius BulaiCMO & Head of Paid Media
Published 9 min read
On this page
Key takeaways
- Don't pick a round number. Spend what your numbers say one client is worth, working backward from back-end gross profit, close rate, show rate and booking rate.
- Subtract what the front end repays. A low-ticket product or paid ticket that recovers most of the ad spend changes what a client really costs.
- Run the pessimistic case first. If it still clears your cash rule, the expected case is margin.
- Test at your planned daily spend for 7 days or about 50 optimization events before you judge or scale. That matches Meta's learning-phase threshold.[1]
- Scale only as fast as your closers can take the calls.
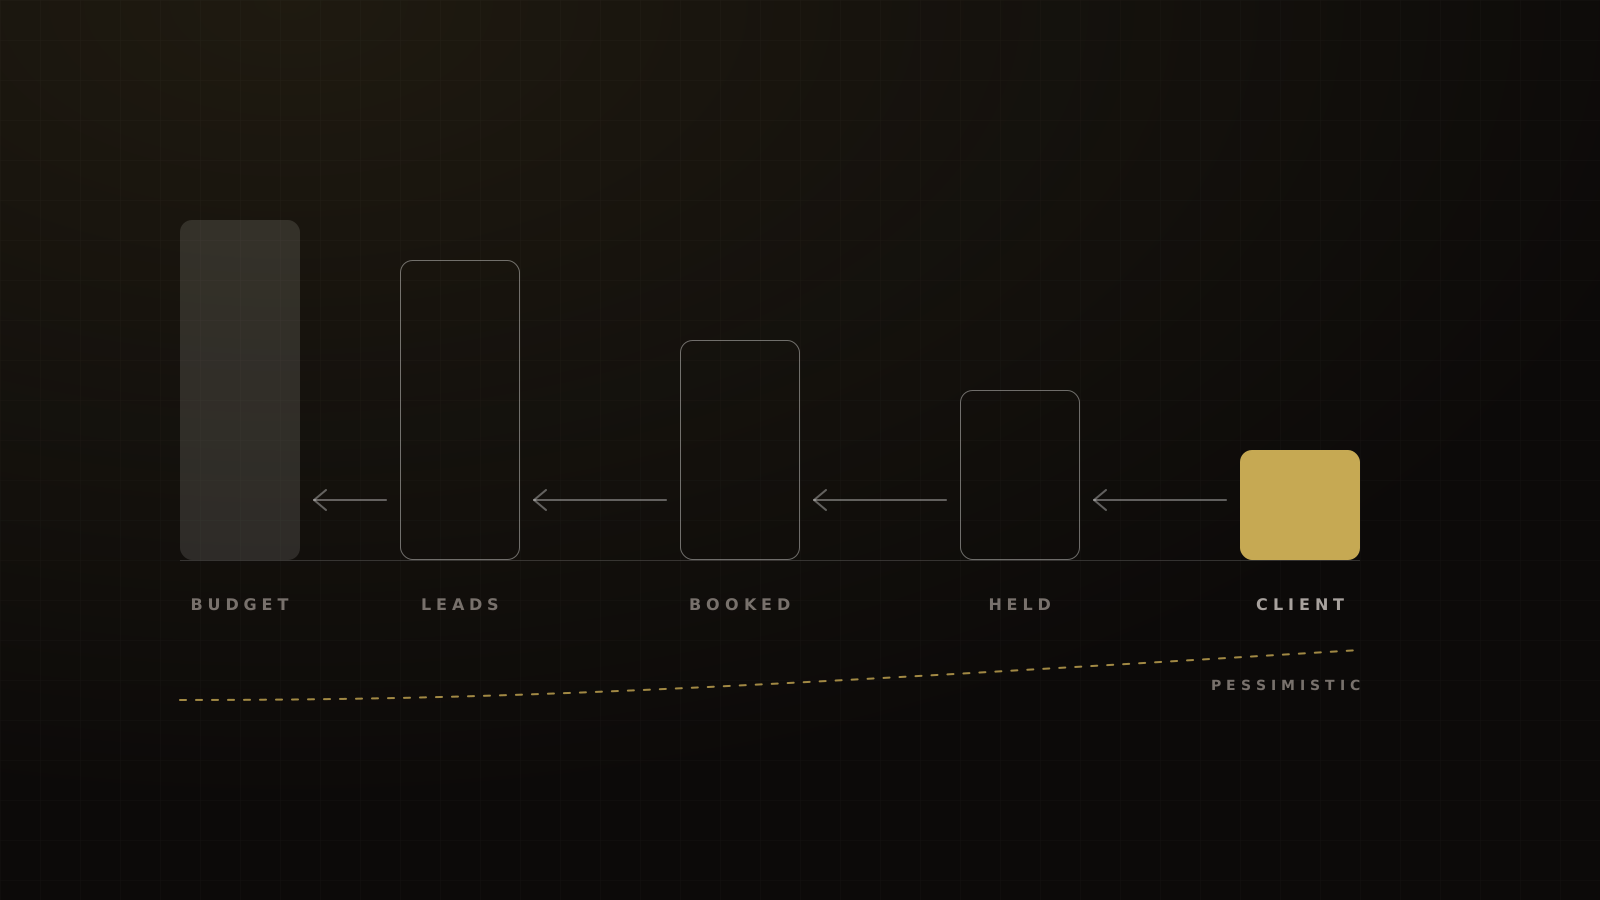
Spend what one client is worth to you, not a round number. Work backward from the back end:
- Allowable CPA: back-end gross profit per client, minus whatever the front end already recovers.
- Affordable cost per booked call: allowable CPA × close rate × call show rate.
- Affordable cost per lead: that figure × booking rate (or, for a webinar, show rate × webinar-to-call rate).
- Daily spend: leads you need per day × cost per lead.
Run it on the pessimistic case first. Then test at your planned daily budget for about a week before you match or raise spend.
Why most ad budget calculators get coaching wrong
The calculators that rank for this question are built for ecommerce or simple lead gen. Encore's ad spend calculator takes deal value, margin and close rate.[2] Vaizle's Facebook ROI calculator runs spend through clicks, site conversion and lead-to-customer rate.[3]
Neither models the two steps that decide a coaching or event funnel: show rate (webinar and sales-call no-shows sit between the lead and the close) and front-end liquidation (a $47 product or a paid ticket repaying part of the spend). Neither gives you a pessimistic case or a test length tied to how Meta's delivery actually learns. This one does.
Work backward from one customer
Allowable CPA
Start with gross profit per client, not price. A $5,000 program that costs $2,500 to deliver is worth $2,500 to your ad budget. Shopify's break-even ROAS formula makes the same point from the other side: break-even ROAS is 1 divided by your gross margin, so a 40% margin needs 2.5x just to break even.[4]
That's break-even. Your allowable CPA should leave room for profit and for the costs ad spend doesn't show. Hormozi's rule is to count acquisition cost fully: ads, media buying, creative and software, not just what Meta charges you.
Subtract what the front end repays
If cold traffic goes to a low-ticket product or a paid ticket first, its revenue comes off the cost of each client:
Back-end CPA = (ad spend − front-end revenue) ÷ back-end clients closed
Our target for a self-liquidating front end is 0.8–1.2x return on ad spend. There's no public industry benchmark for this; it's the target we hold. For free webinars, a paid order bump after registration is the lighter version. In our experience it recovers about 40–50% of webinar ad spend. No public benchmark exists for bumps after a free registration.
Cost per booked call, including show rate
This is the step most budgets skip. You don't pay for a client per lead or per booking. You pay per held call, because closers can only close the calls that happen.
On the funnels we run, booked high-ticket calls show at 82–88% when they're booked no more than about three days out. RevenueHero's B2B data puts the average sales-meeting no-show at 15.9%, a median of 13.5%.[5] In a one-week snapshot of 425 education and e-learning software meetings, it was 18.1%.[6] Use the low end of your own range for the pessimistic case.
The calculator
Inputs you need
- Back-end price and gross margin. What one client is worth after delivery costs.
- Close rate on held calls. Your own number. No method-disclosed coaching close rate exists, so don't borrow one.
- Call show rate. Share of booked calls that happen.
- Booking rate. Share of leads who book a call. For a webinar funnel, use live show rate × attendee-to-buyer or attendee-to-call rate instead.
- Front-end price and conversion rate, if you sell a low-ticket product or paid ticket first.
- Cost per lead. Start from the defaults below, then replace them with your own data.
- Clients you want per month.
Default cost per lead. For a curiosity-led cold opt-in, we typically see $15–25 on the funnels we run. For a first cold webinar test before optimization, $12–20 per registration. For the pessimistic case, use the industry figures: LocaliQ's 2026 average for Education and Instruction lead campaigns is $26.31, and its all-industry average is $27.39.[7] WordStream's 2025 median for Education, from 1,180 campaigns, was $28.22.[8] If you sell a personal service rather than education, Personal Services ran $38.09 in LocaliQ's 2026 data.[7]
Then add a cushion. Meta's average price per ad rose 12% year over year in Q1 2026 and again in Q2 2026.[9][10] That's a company-wide average, not your CPL, but it's why our pessimistic case adds 25% to cost per lead.
Default booking rate. There's no coaching benchmark. For B2B context, Chili Piper's mid-market data shows a typical company books 42 meetings per 100 website form submissions, with 26 in the bottom quartile, from 2.9 million submissions.[11] Cold Meta leads for a coaching offer usually book well below that. Treat it as a ceiling, not a default.
Default webinar rates. On a cold-traffic evening webinar with a two-day ad window, we typically see 25–35% of registrants attend live. Banzai's 2023 Demio data puts education services at 20% and hosts under $1M in revenue at 22%.[12] Livestorm's 2025 platform data shows 47.7% across 33,786 mostly B2B sessions, which we treat as the optimistic end.[13] For a $1,000–$10,000 offer, our rule of thumb for live attendee to buyer is 6–10% when it's working and 1–3% when it isn't. There's no public benchmark for that one.
Worked example (illustration, not a client result)
A coach sells a $5,000 program with a 50% gross margin, so each client is worth $2,500 in gross profit. Twenty percent of held calls close, 85% of booked calls show, and 10% of leads book. Cost per lead is $26. The goal is 10 clients a month. Every number here is made up to show the math.
| Expected | Pessimistic | |
|---|---|---|
| Cost per lead | $26.00 | $32.50 |
| Call show rate | 85% | 75% |
| Cost per booked call | $260 | $325 |
| Cost per held call | $306 | $433 |
| Cost per client (ads only) | $1,529 | $2,167 |
| Gross profit ÷ cost per client | 1.63x | 1.15x |
| Leads needed per month | 588 | 667 |
| Monthly spend | $15,294 | $21,667 |
| Daily spend | about $510 | about $722 |
Hypothetical inputs. Pessimistic case: cost per lead +25%, show rate −10 points. Ad spend only; fully loaded CAC would be higher.
The break-even cost per lead here is $42.50 ($2,500 × 20% × 85% × 10%). So on paper, $26 leads look comfortable.
The pessimistic column tells the real story. At $32.50 leads and a 75% show rate, each client costs $2,167 and returns 1.15x gross profit. That's still above break-even, but it fails our cash rule: we want at least 1.5x fully loaded acquisition cost back within 30 days before raising spend. That rule is a target, not a result, and Hormozi's stated real-life minimum is 2x. So this budget is a test budget, not a scaling budget, until real numbers come in.
Now the strong case. On the weekly evening webinar program we run, our current best cost per registration is $4–5, against $8–10 as our best for years. That program returns 4–7x ROAS week over week, with ads running only in the two days before each session. Plug numbers like those into the webinar path and the cost per live buyer drops by an order of magnitude:
| Pessimistic | Expected | Strong | |
|---|---|---|---|
| Cost per registration | $28.22 | $16 | $4.50 |
| Live show rate | 20% | 30% | 35% |
| Live attendee → buyer | 3% | 6% | 10% |
| Cost per live buyer | about $4,703 | about $889 | about $129 |
Live sales only. Hypothetical combinations of the ranges above, not a forecast. Sales that close after the live session would lower every figure.
Build your budget on the left column. Celebrate if you land in the right one.
How long and how much to test
Run 7 days or about 50 optimization events. Meta says an ad set usually exits learning after about 50 results in the week after its last significant edit.[1] Our stress test before any scale-up is 7 days at the planned daily spend on a capped audience, or until about 50 optimization events. Meta's A/B testing guidance points the same way: run tests for at least 7 days, and longer if buyers take more than a week to convert.[14]
Check the daily budget against the event. Meta's troubleshooting rule of thumb is a daily budget of at least 10 times the average cost of your optimization event.[15] If you use a cost-per-result goal, Meta's minimum is 5 times that goal.[16] At a $26 lead, the 10× check means at least $260 a day. If you optimize on a $260 booked call, it means $2,600 a day, which is why most coaching accounts optimize on the lead and send booked calls back as a signal.
Calculator
Meta ads test budget calculator
Set a daily budget that can buy enough optimization events to leave the learning phase, and cap the test before it starts.
Example inputs. Replace with your numbers.
Daily budget
$325
Set by Meta's 10× rule
- Weekly budget
- $2,275
- Test budget7 days. Set it as a lifetime budget: a hard cap
- $2,275
- Cost per event, with cushion
- $32.50
- Learning-phase pace50 events a week ÷ 7 days
- $232
- Meta's 10× checkDaily budget ≥ 10 × cost per event
- $325
- Events the test should buy
- 70
Change one variable at a time. A large budget jump can send an ad set back into learning.
How this is calculated
- Cost per event = target CPA × (1 + pessimistic cushion)
- Learning-phase pace = cost per event × conversions needed per week ÷ 7
- Meta's 10× check = 10 × cost per event
- Daily budget = the larger of the two
- Weekly budget = daily budget × 7
- Test budget = daily budget × test days
Estimates for planning, not a promise of results. The example inputs are illustrations, not Victory client results.
Cap the loss with a lifetime budget. A daily budget is an average. Meta may spend up to 75% over it on some days, though never more than 7 times the daily budget in a week. A lifetime budget is a hard cap.[17] For a test, that's what you want.
Change one variable at a time. Hormozi's test rule in $100M Leads is to give a new ad up to twice the cash a customer brings in during their first 30 days, and cut it at 1x if it hasn't produced one. Claude Hopkins made the same argument a century earlier: prove it on a small test before you spend big.
When to raise the budget
Raise spend when the real numbers clear the pessimistic case, not before. Then raise it carefully. Meta treats a large budget change as a significant edit that can send an ad set back into learning: $100 to $101 won't, $100 to $1,000 may.[18]
Two limits matter more than the algorithm.
Closer capacity. One full-time closer can hold 4–6 high-ticket calls a day at 80% calendar fill. That's our working assumption, not an industry benchmark. For context, B2B SDRs average 4.1 quality conversations a day in Bridge Group's 2025 survey, 4.6 on phone-heavy teams.[19] If your ads book more calls than your team can hold, extra spend buys no-shows.
Conversion first. Fix opt-in, show and close rates before you add spend. Scaling a leaky funnel scales the leak. If you get to 200 or more leads a month on Instant Forms, you also qualify for Meta's conversion leads optimization, which lets Meta optimize on your CRM stages.[20] Our Conversions API guide covers how.
For more on what to measure once the money is moving, see the KPIs that matter for event and webinar funnels, our 2026 Facebook ads benchmarks for coaches, and, if you sell events, our event marketing and show-rate guide.
Use the calculator above to run your own numbers, or book a strategy call and we'll run them with you.
Frequently asked questions
Sources
- 1.About the learning phase. Meta Business Help Center, living doc, checked 2026-10-04.
- 2.Ad spend calculator. Encore, living tool, checked 2026-10-04.
- 3.Facebook ads ROI calculator. Vaizle, living tool, checked 2026-10-04.
- 4.Break-even ROAS calculator. Shopify, 2026-09-02.
- 5.Ways to reduce no-show rates in sales calls. RevenueHero, undated, checked 2026-10-04.
- 6.No-show benchmark, week of December 2, 2024. RevenueHero, 2024-12-13.
- 7.Facebook advertising benchmarks (2026 edition). LocaliQ, 2026-09-23.
- 8.Facebook ads benchmarks 2025 (guide, PDF). WordStream by LocaliQ, 2025-09.
- 9.Meta reports first quarter 2026 results (Exhibit 99.1). Meta Platforms, SEC filing, 2026-04-29.
- 10.Meta reports second quarter 2026 results (Exhibit 99.1). Meta Platforms, SEC filing, 2026-07-29.
- 11.2026 web conversion benchmark: mid-market. Chili Piper, 2026.
- 12.Webinar statistics 2024 (2023 Demio data). Banzai (Demio), 2024-01.
- 13.Webinar benchmark report 2026. Livestorm, 2026-09-01.
- 14.A/B testing best practices. Meta Business Help Center, living doc, checked 2026-10-04.
- 15.Troubleshoot ad sets that aren't delivering. Meta Business Help Center, living doc, checked 2026-10-04.
- 16.Minimum daily budgets with a cost per result goal. Meta Business Help Center, living doc, checked 2026-10-04.
- 17.About daily and lifetime budgets. Meta Business Help Center, living doc, checked 2026-10-04.
- 18.About significant edits and the learning phase. Meta Business Help Center, living doc, checked 2026-10-04.
- 19.2025 SDR models and metrics report. The Bridge Group, 2025-02-06.
- 20.Conversion leads integration. Meta for Developers, living doc, checked 2026-10-04.
Written by
Marius BulaiCMO & Head of Paid Media
Marius runs all paid media strategy and execution at Victory. Before Victory he was Head of Analytics at Hyros, inside the data of some of the largest ad accounts in the world.
Part of the guide: Paid Ads for Coaches, Course Creators and Event Businesses: Meta, Creative and Attribution Tied to Cash