Why Your ROAS Is Lying: The KPIs That Matter for Event and Webinar Funnels
Platform ROAS is a different ledger, not your bank. How to reconcile Meta, CRM and cash weekly, and the non-blended scorecard we run on webinar funnels.
 Marius BulaiCMO & Head of Paid Media
Published 10 min read
On this page
Key takeaways
- Platform ROAS isn't a lie. It's a different ledger: conversions Meta attributes to its ads inside a chosen window, some of them modeled.[1][2]
- Since 2026-01-12, Meta's Ads Insights API no longer returns 7-day view or 28-day view data. If your reports used them, your baseline broke that day.[3]
- Attributed isn't incremental, and the gap runs both ways. Haus found every $100 of Meta-attributed DTC revenue matched $115 of incremental revenue.[4]
- Reconcile Meta, the CRM and the payment processor to cash collected every week. Then manage a non-blended scorecard: cost per registration, cost per show, cost per booked call, back-end CPA and cash against target.
- "Leads but no sales" is often a closing-capacity problem. Check speed to lead and calendar load before you touch the ads.
Your ROAS isn't lying so much as keeping a different set of books. Meta counts the conversions it attributes to its ads, inside a window you chose, partly modeled, on its own dates. It doesn't count the cash you actually collected after payment plans, refunds and no-shows.
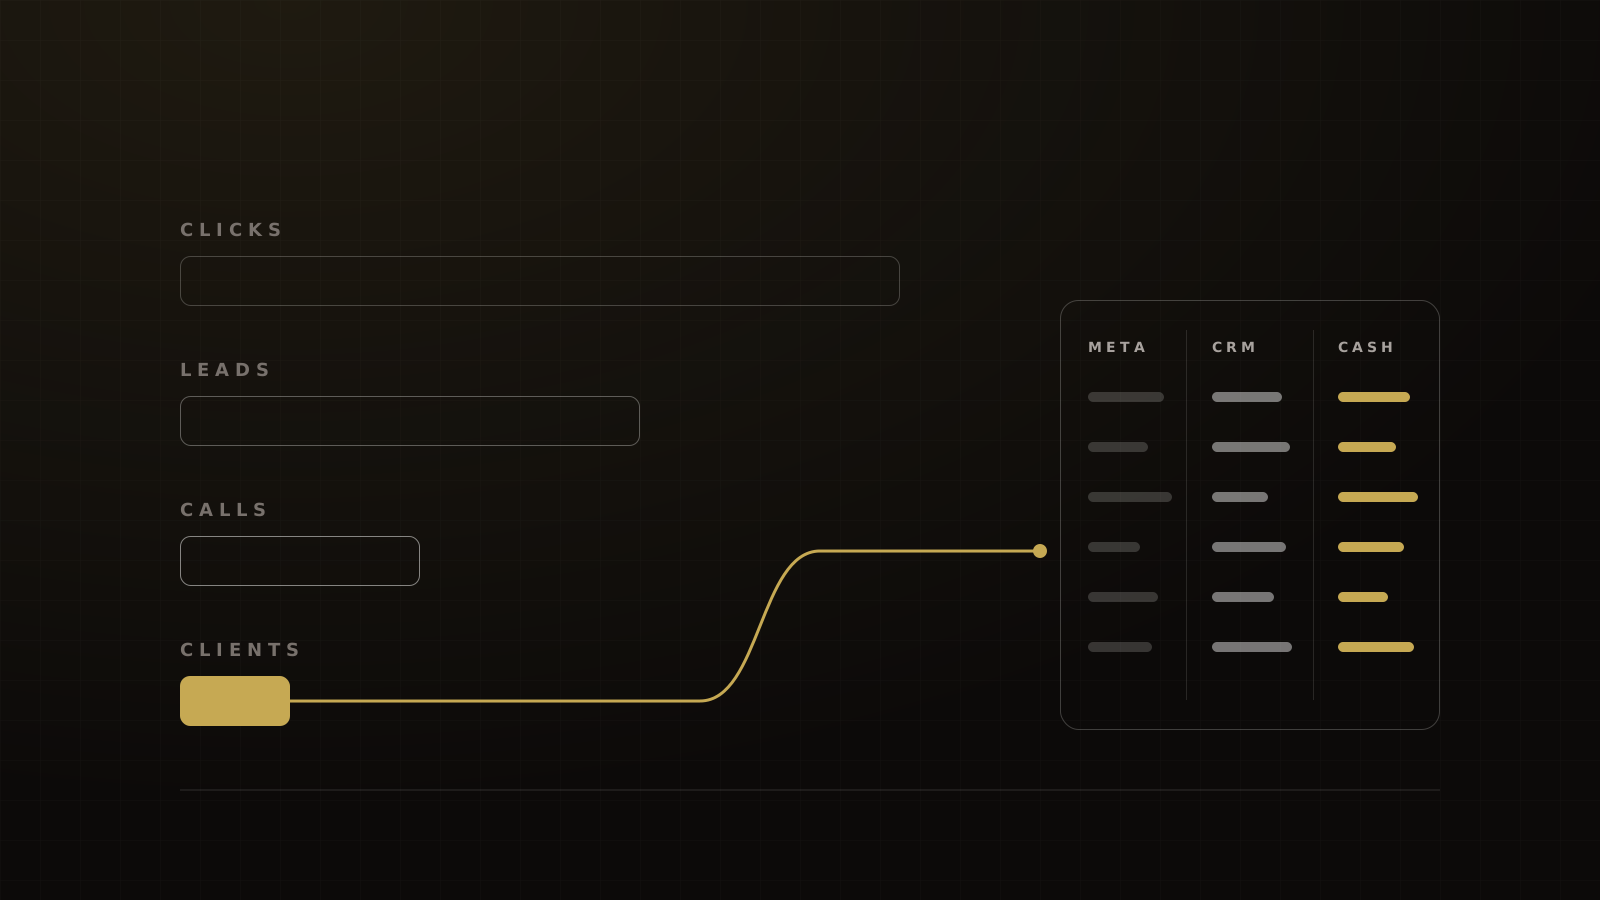
So stop arguing with the number and reconcile it. Every week, line up Meta, your CRM and your payment processor against cash collected. Then run the business on a non-blended scorecard built for funnels where the money lands weeks after the lead.
The short answer
Platform ROAS answers one question: how much revenue does Meta credit to Meta? Blended ROAS, also called MER, answers another: total revenue divided by total marketing spend.[5] Neither tells you which stage of an event or webinar funnel is broken.
Cost per lead alone misleads too. In our experience, a curiosity-led event opt-in on cold Meta traffic costs $15 to $25 a lead. LocaliQ's 2026 average for education lead campaigns is $26.31.[6] A cheap lead that never shows up and never books a call is the most expensive lead you'll buy.
The fix is five numbers, read stage by stage, against cash.
Three reasons platform ROAS disagrees with your bank
Windows and dates: what Meta counts
Meta's default attribution setting counts conversions within 7 days of a click, 1 day of a view and 1 day of an engagement. Where conversion data is partial, the results can include modeled conversions.[1] Ads Manager fills gaps with statistical modeling, so "reported" doesn't always mean individually observed.[2] Meta also says not to compare results across its attribution models.[7]
Then the window moved. Meta announced in October 2025 that from 2026-01-12, the Ads Insights API would stop returning 7-day view and 28-day view data.[3] If ROAS dropped in January with nothing else changed, check your reporting settings before your creative. The 1-day view window still exists.[7]
Webinar funnels make this worse. On the funnels we run, 30% to 50% of a webinar's sales close after the live session, through the replay and the follow-up. There's no industry benchmark for that, but the effect is plain: many sales land after a sales call, days later, well outside a short click window.
Attributed isn't incremental
Attribution credits an ad that was present. Incrementality asks whether the sale would have happened anyway.
In Gordon, Moakler and Zettelmeyer's 2023 study of 663 Facebook experiments, median measured lifts were 29%, 18% and 5% for upper, mid and lower-funnel outcomes. Observational methods estimated 83%, 58% and 24%.[8] That study tests causal-inference methods, not Ads Manager ROAS, but the lesson carries: correlation-based credit tends to run high.
It doesn't always. Haus's experiments on Meta found every $100 of 7-day-click attributed revenue matched $115 of incremental revenue, mostly for DTC brands.[4] Attribution can undercount as well as overcount. The only way to know which way yours runs is to test it.
Tracking gaps and double counts
What Meta sees depends on what you send it. Meta reports that advertisers with a Conversions API web setup see 17.8% lower cost per result on average. It doesn't show the method, and it's an observational comparison, not a controlled test.[9]
Gaps cut the other way too. Hyros publishes one account where Facebook reported 42 booked calls and Hyros tracked 116.[10] That's a vendor illustration with no method, but we see the pattern often: scripts missing from embedded forms, calendar steps in iframes, or the booking page on a different domain. Our Hyros review covers those failure points.
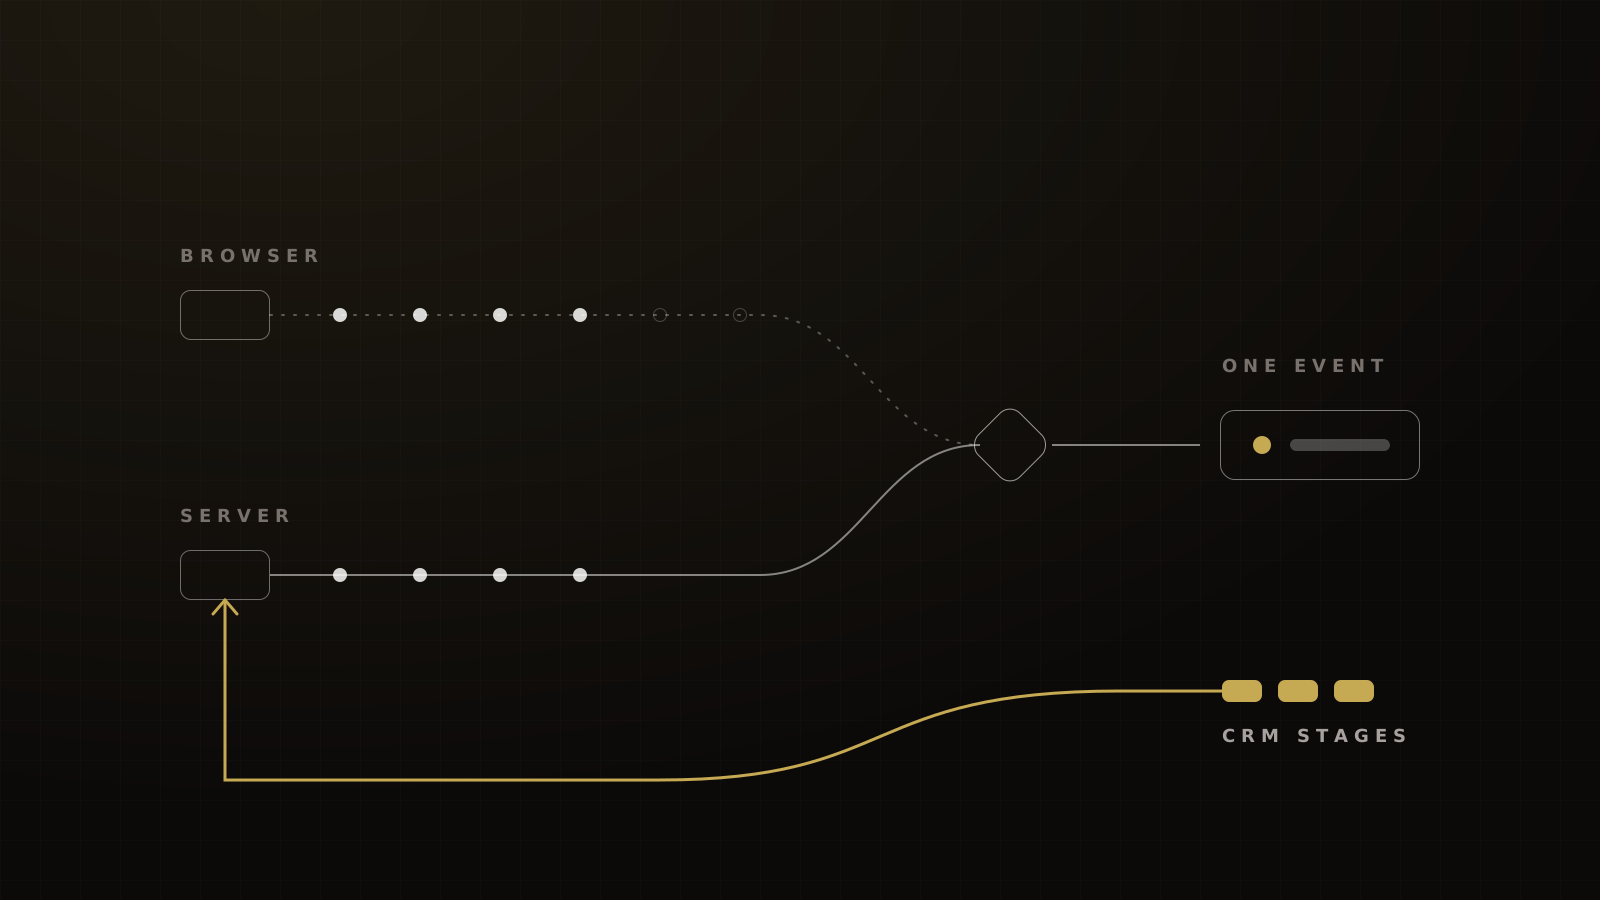
Double counts are the mirror image. Meta only discards a duplicate browser and server event when the event ID and event name match and both arrive within 48 hours.[11] Miss that and one sale becomes two.
Reconcile to cash collected every week
Three systems will give you three answers. That's normal. The job is to know why they differ.
| Ledger | What it counts | Why it differs |
|---|---|---|
| Meta | Conversions attributed inside the window, some modeled | Window length, view credit, missing or duplicate events |
| CRM (HighLevel) | First and latest recorded interaction on the contact | Only captures its own forms, calendars, chat widget and order forms[12] |
| Processor (Stripe) | Cash actually charged and refunded | Webhooks retry for up to three days, can duplicate and arrive out of order[13] |
Use the processor as the ledger. The other two are opinions about where the money came from.
GA4 is a fourth opinion, not the ledger. It now offers three attribution models; first-click, linear, time-decay and position-based were removed in November 2023.[14]
The weekly reconciliation
- Pull cash collected from the processor for the week, net of refunds.
- Split payment plans: count the instalments collected, not the contract value.
- Remove test orders, including any 100%-discount test purchase.
- Check currency settings and whether refunds synced to your attribution tool. Hyros lists both as common causes of mismatched revenue.[15]
- Match each sale to a CRM contact, then to a first and latest source.
- Compare the total with what Meta reports for the same week, and write down the gap.
The non-blended scorecard for event and webinar funnels
Report each stage on its own, with a target beside each actual. Blending hides the stage that broke.
Cost per registration → cost per show
Costs are rising regardless of what you do. Meta's average price per ad was up 12% year over year in Q2 2026.[16] So divide by the people who turned up, not the people who signed up.
On the cold-traffic evening webinars we run, 25% to 35% of registrants show up live. Industry figures run higher: Livestorm measured 47.7% across 33,786 sessions in 2025,[17] and Goldcast measured 40% across 26,190 B2B webinars.[18] Those are mostly B2B and house-list audiences, which show better than cold paid traffic. Use your own cold number, or your cost per show will look better than it is.
Cost per booked call (including show rate)
Divide spend by calls held, not calls booked. On calls booked no more than about three days out, we typically see 82% to 88% show. RevenueHero's average B2B meeting no-show is 15.9%.[19] A $200 booked call at 75% show is a $267 held call.
One agency reports $150 to $350 of Meta spend per booked high-ticket coaching call across its clients, with no method published.[20] It's the only public range we've found. Treat it as one data point, not a benchmark.
Back-end CPA and front-end liquidation
This is the number we manage to:
Back-end CPA = (ad spend − front-end revenue) ÷ back-end sales
Run it on the pessimistic case. For a self-liquidating offer, our target is a front-end ROAS of 0.8 to 1.2 at scale, judged on the back-end CPA it produces. There's no public benchmark for that; it's the target we hold. On a free webinar, a paid order bump on the registration page typically recovers 40% to 50% of ad spend on the funnels we run.
Front-end ROAS under 1.0 is fine when the back end pays. An online academy with a $5 entry offer will never show a pretty front-end number. Judge it by what each back-end sale costs.
Cash collected vs target
Alex Hormozi's 30-day cash idea is the anchor: what a new customer pays in the first 30 days should cover what it cost to get them, so growth funds itself. He puts the real-world minimum for customer-financed growth at 2x. Our target before we raise spend on a client funnel is at least 1.5x fully loaded acquisition cost in 30-day cash. It's a target, not a reported result.
Claude Hopkins made the same point a century ago in Scientific Advertising: key every ad, and judge it by what a customer costs. Hormozi's lifetime gross profit to CAC ratio is the long version of the same test.
A worked example (illustration, not a client result)
| Stage | Count or amount | Scorecard number |
|---|---|---|
| Ad spend | $10,000 | |
| Registrations | 500 | $20 per registration |
| Live attendees (30%) | 150 | $67 per show |
| Order bump revenue | $4,500 | 0.45 front-end ROAS |
| Booked calls | 40 | $250 per booked call |
| Calls held (85%) | 34 | $294 per held call |
| Sales | 9 | $611 back-end CPA |
| Cash collected in 30 days | $23,500 | 1.85x fully loaded cost |
Every figure is hypothetical, chosen to show the math. Swap in your own rates and prices.
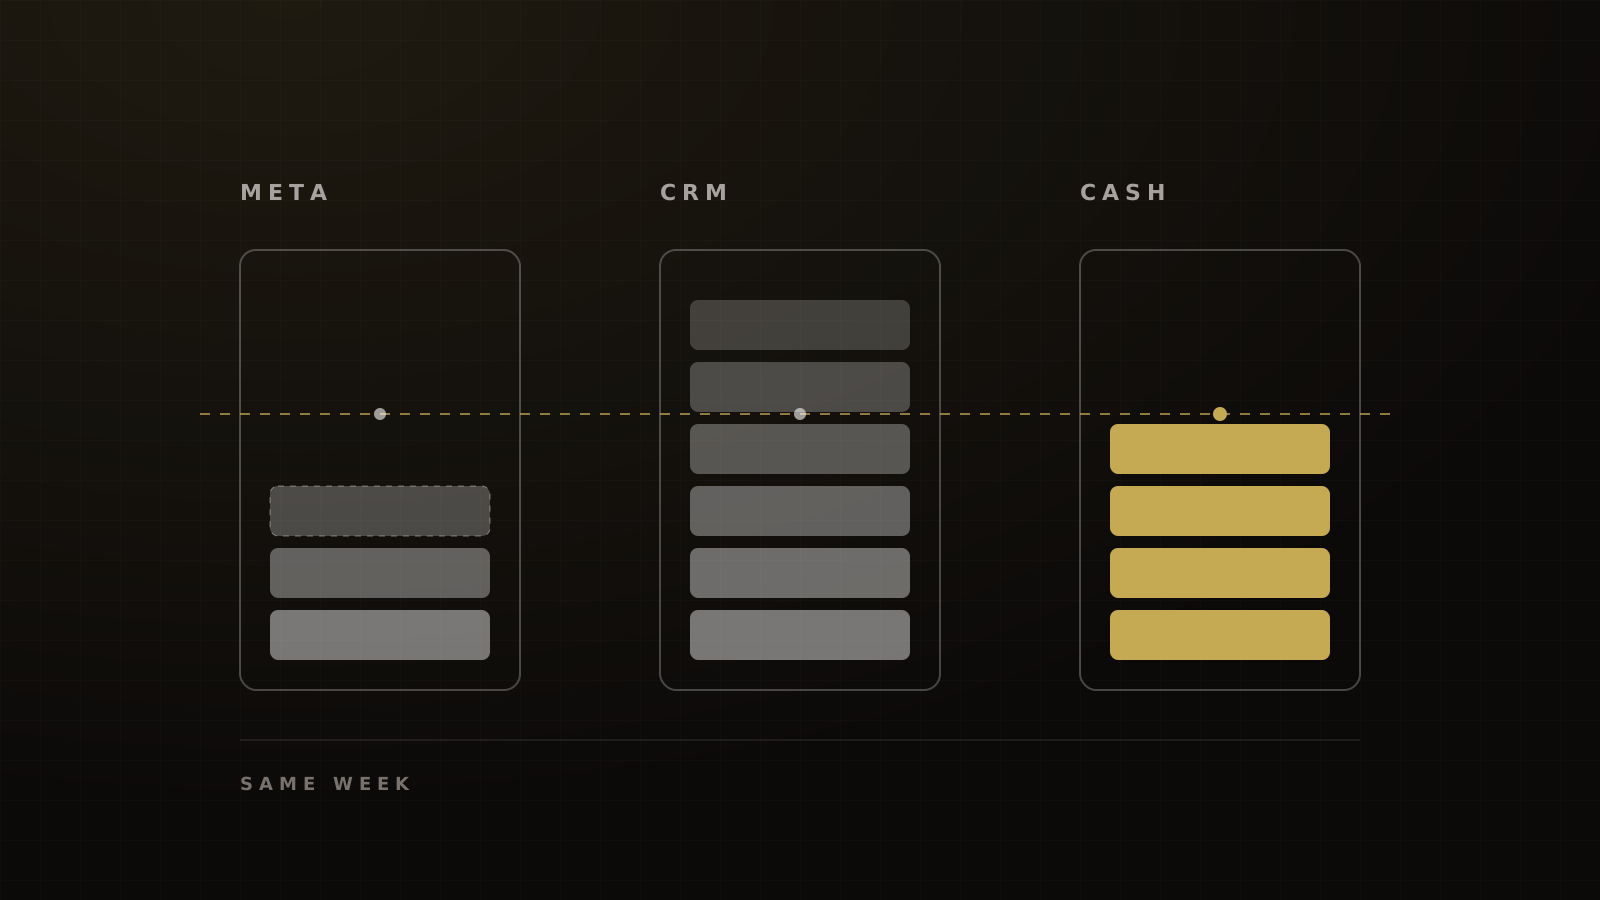
Now the three ledgers. Say Meta credits the bump and four of the nine sales inside its window: $16,500, a 1.65x ROAS. The CRM shows $31,500 booked, 3.15x. Cash collected, with five paid in full and four on payment plans, is $23,500, or 2.35x on ad spend. Add $2,700 in closer commission and the fully loaded cost is $12,700, so 30-day cash runs 1.85x.
Same week, three ROAS figures. Only one of them pays the bills.
"Leads but no sales" isn't always an ads problem
Lead generation and closing are two engines. When the first runs faster than the second, the ads look broken. They aren't.
Speed is the first check. The original lead-response study, from InsideSales.com and MIT in 2007, covered more than 15,000 leads at six companies. The odds of qualifying a lead called within 5 minutes were 21 times higher than at 30 minutes, and the odds of reaching them 100 times higher.[21] That's qualification, not closing, and it's not the HBR study it's often credited to. It's still the clearest case for calling fast.
Our standard is a median first dial under one hour during staffed hours, and every new lead dialed within 24 hours.
Capacity is the second check. We add a setter only when closers' calendars sit at 75% to 80% and more than about 20% of new leads are still uncalled after 24 hours. If that's you, more leads will make the numbers worse. Our high-ticket sales team guide covers the structure.
Show rate is the third. A full calendar of no-shows looks like a closing problem and is really a booking-window problem.
Beyond attribution: lift tests and MMM
Meta's incremental attribution model optimizes for conversions its models predict were caused by an ad. It's a machine-learning prediction, not a randomized lift test.[22] Meta says testers saw 46% more incremental conversions on average, with no method published.[23]
Test the setting rather than assume it. Haus found incremental attribution beat standard attribution on measured iROAS by 1.26x from July 2025 to June 2026, reversed from 0.80x the year before.[24] Measured puts median Meta iROAS at $2.16 per dollar across more than 10,000 campaigns.[25] At scale, an open-source mix model such as Meta's Robyn can be calibrated to lift tests.[26] For most coaches, a cash ledger plus an occasional lift test is enough.
How we report at Victory
For the full paid strategy, start with our paid ads guide for coaches. To sanity-check your costs, see Meta ads benchmarks for coaches, and to set spend from back-end CPA, use the Meta ads budget calculator. If you can't tell which ledger to trust, get a funnel audit and we'll reconcile one week with you.
Frequently asked questions
Sources
- 1.About attribution settings. Meta Business Help Center, living doc, checked 2026-10-04.
- 2.About modeled conversions. Meta Business Help Center, living doc, checked 2026-10-04.
- 3.Ads Insights API metric availability updates. Meta for Developers blog, 2025-10-16.
- 4.Is Meta incremental?. Haus, 2025-08-13.
- 5.Marketing efficiency ratio (MER). Shopify, 2026-07-18.
- 6.Facebook advertising benchmarks (2026 edition). LocaliQ, 2026-09-23.
- 7.About attribution models: standard, incremental and custom. Meta Business Help Center, living doc, checked 2026-10-04.
- 8.Close enough? A large-scale exploration of non-experimental approaches to advertising measurement. Gordon, Moakler and Zettelmeyer, Marketing Science 42(4), 2023-07.
- 9.Conversions API. Meta, 2026-04-15.
- 10.Info product tracking. Hyros, 2026 (exact date unverified).
- 11.Deduplicate Pixel and server events. Meta for Developers, living doc, checked 2026-10-04.
- 12.Understanding attribution source (ad reporting). HighLevel Support Portal, 2026-08-26 (modified).
- 13.Webhooks. Stripe Docs, living doc, checked 2026-10-04.
- 14.Attribution models in Google Analytics. Google Analytics Help, living doc, checked 2026-10-04.
- 15.Troubleshooting: common issues. Hyros Docs, undated, checked 2026-10-04.
- 16.Second quarter 2026 results, Exhibit 99.1. Meta Platforms (SEC filing), 2026-07-29.
- 17.Webinar benchmark report 2026. Livestorm, 2026-09-01.
- 18.2026 B2B Webinar Benchmark Report. Goldcast, 2026.
- 19.Ways to reduce no-show rates in sales calls. RevenueHero, undated, checked 2026-10-04.
- 20.Cost per booked call benchmarks. 780 Marketing, 2026-07-03.
- 21.Lead Response Management study. InsideSales.com and MIT (Elkington, Oldroyd), 2007.
- 22.About incremental attribution. Meta Business Help Center, living doc, checked 2026-10-04.
- 23.Optimize conversions for business values. Meta for Business, 2025-06-04.
- 24.Is Meta's incremental attribution outperforming standard attribution? What the data shows. Haus, 2026-07-16.
- 25.Incrementality analysis: Meta platform performance. Measured, 2026-06-02.
- 26.Robyn: open-source marketing mix modeling. Meta Marketing Science, living doc, checked 2026-10-04.
Written by
Marius BulaiCMO & Head of Paid Media
Marius runs all paid media strategy and execution at Victory. Before Victory he was Head of Analytics at Hyros, inside the data of some of the largest ad accounts in the world.
Part of the guide: Paid Ads for Coaches, Course Creators and Event Businesses: Meta, Creative and Attribution Tied to Cash