Webinar Funnel Calculator: How Much to Spend on Your First Webinar
Work backward from buyers to attendees, registrations and ad spend, with sourced defaults and the cheap baseline test we run before any webinar launch.
 Ray GillespieCo-Founder & COO
Published 8 min read
On this page
Key takeaways
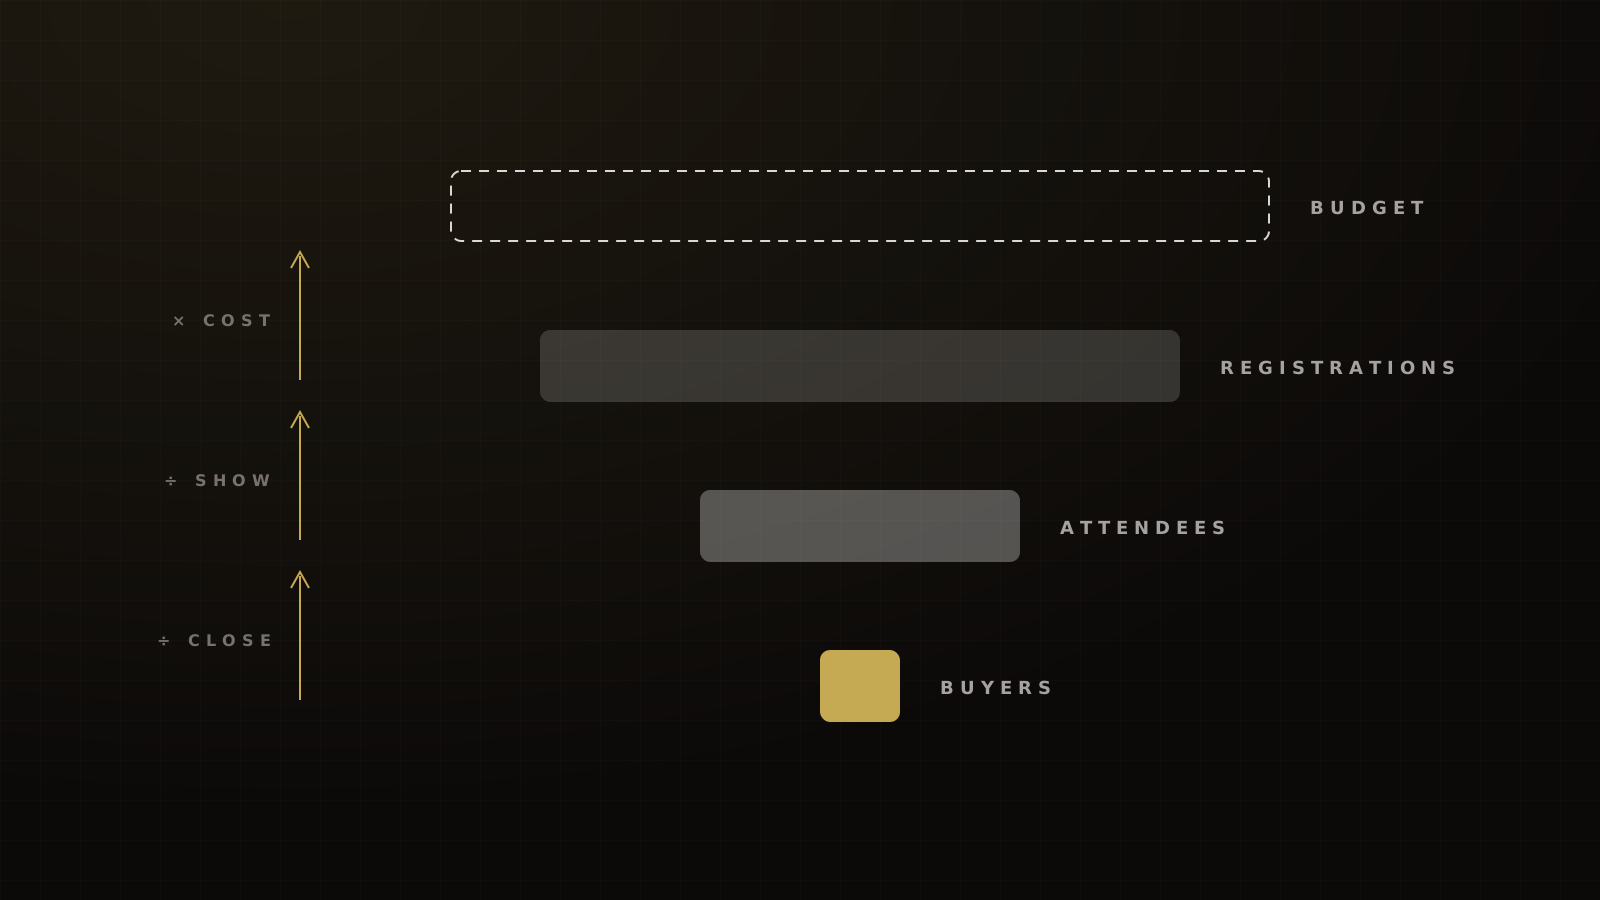
- Work backward from buyers: buyers ÷ close rate = attendees; attendees ÷ show rate = registrations; registrations × cost per registration = ad budget.
- Your first webinar is a baseline test, not a launch. Budget to learn your real show and close rates, then scale.
- Cost per registration and show rate swing the budget more than anything else. At the same offer and close rate, the budget can move from $4,000 to $22,400.
- The public Meta yardstick for education leads is $26 to $28.[1][2] Our first cold tests usually land at $12 to $20, and our tuned weekly program buys registrations at $4 to $5.
- Put paid spend in the last two days before the webinar. Registrations cluster late anyway.[3]
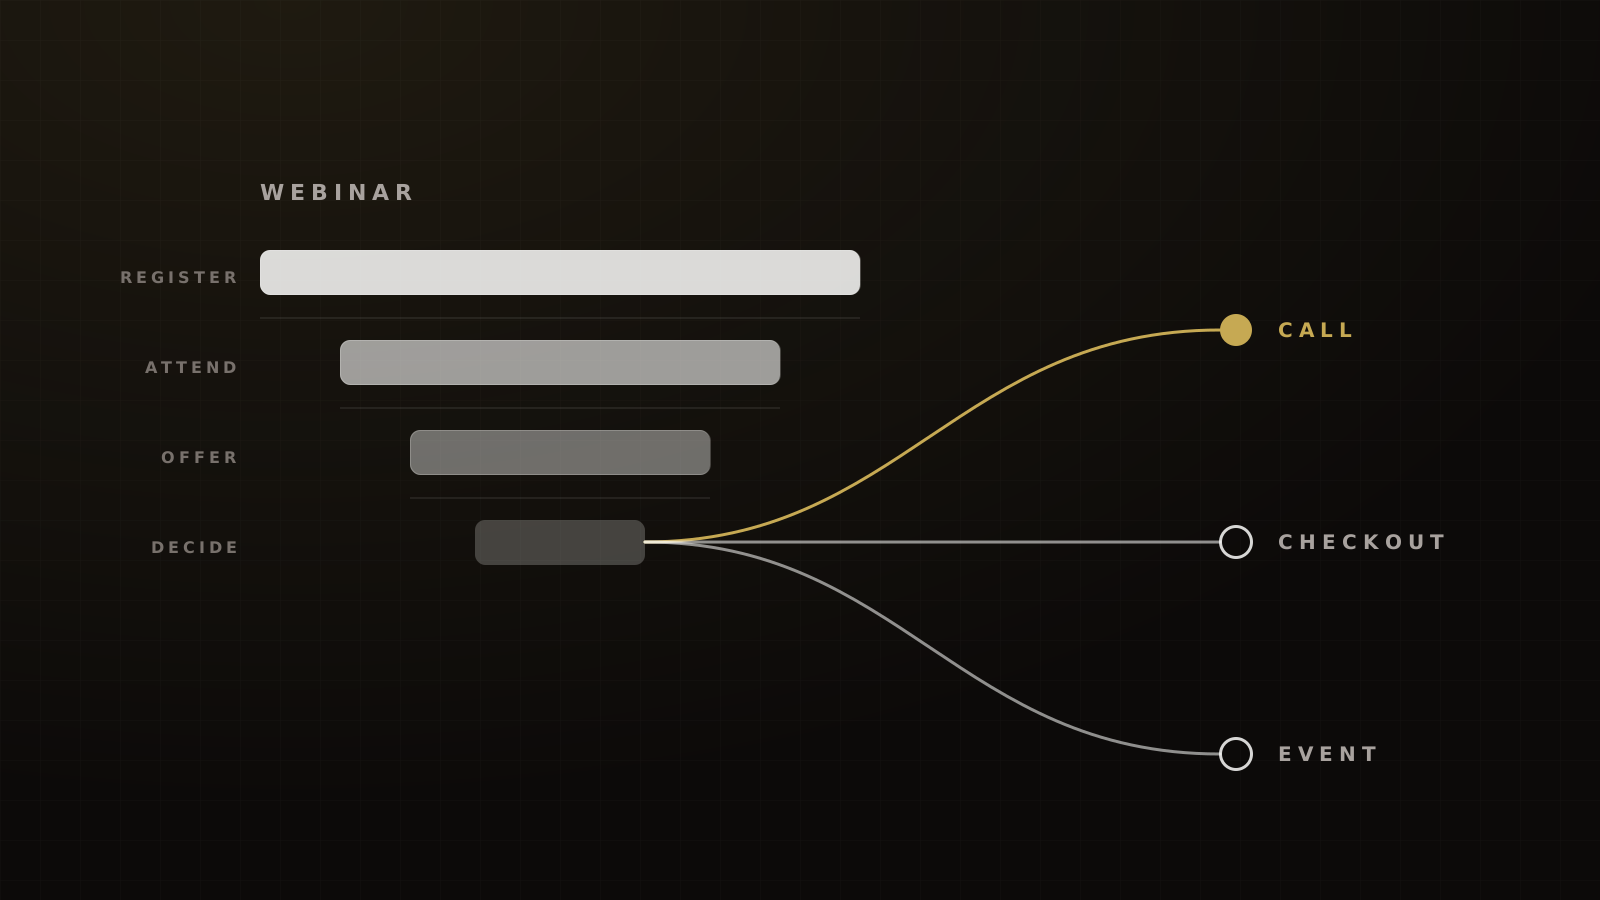
Start from the number of buyers you want and work backward. Close rate turns buyers into the attendees you need. Show rate turns attendees into registrations. Cost per registration turns registrations into an ad budget.
Then shrink it. Your first webinar should be cheap on purpose: a small daily budget plus your own list, run to learn your real show and close rates. Most calculators skip that step and hand you unsourced defaults. Here are the formulas, the defaults with their sources and catches, and the test we run before we spend real money.
The calculator
Enter your own numbers below. Where you don't have one yet, use the preset in the table under it and replace it after the first webinar.
Calculator
Webinar funnel calculator
From ad spend to registrations, buyers and ROAS, plus the most you can pay per registration and still break even.
Example inputs. Replace with your numbers.
ROAS on live sales
3.86x
$7,720 revenue on $2,000 of ads
- Registrations
- 125
- Live attendees
- 37.5
- BuyersExpected value, not rounded
- 2.3
- Revenue$6,750 offer + $970 bump
- $7,720
- Cost per attendee
- $53.33
- Break-even cost per registrationYou're $45.76 under it
- $61.76
Live sales only. Sales through the replay and follow-up window would add to this.
How this is calculated
- Registrations = ad spend ÷ cost per registration
- Live attendees = registrations × show rate
- Buyers = live attendees × attendee → buyer rate
- Revenue = buyers × offer price + registrations × bump take rate × bump price
- ROAS = revenue ÷ ad spend
- Cost per attendee = ad spend ÷ live attendees
- Break-even cost per registration = show rate × attendee → buyer rate × offer price + bump take rate × bump price
Estimates for planning, not a promise of results. The example inputs are illustrations, not Victory client results.
| Input | Preset if you have none |
|---|---|
| Buyers wanted | Your goal |
| Offer price | Your price |
| Live attendee → buyer (close rate) | 6% to 10% is good; 1% to 3% is failing |
| Registrant → live attendee (show rate) | 25% to 35% cold traffic; 40% to 50% warm list |
| Cost per registration | $12 to $20 on a first cold test |
| Landing-page conversion (optional) | 22% to 30% of cold paid visitors |
| Sales after the live session (optional) | 30% to 50% of total sales |
| Paid bump recovery (optional) | 40% to 50% of ad spend |
Presets are Victory's operator ranges from the funnels we run, not a dataset. Industry figures and their sources are in the next section.
Framework
The webinar budget, backward from buyers
- Attendees needed = buyers wanted ÷ close rate
- Registrations needed = attendees needed ÷ show rate
- Ad budget = registrations needed × cost per registration
- Landing-page visitors (optional) = registrations needed ÷ landing-page conversion
- Revenue and ROAS = buyers × price, then revenue ÷ ad budget
- Max cost per registration you can afford = what you'll pay to acquire a buyer × show rate × close rate
Victory's planning method. The max-cost formula is the same math run in reverse.
How the math works, backward from buyers
Here is the method with made-up numbers. Say a $3,000 offer, 10 buyers wanted, a 5% close rate and a 25% show rate. This is an illustration, not a client result.
10 buyers ÷ 5% = 200 attendees. 200 attendees ÷ 25% = 800 registrations. Now the cost per registration decides everything:
| $28 per registration | $10 per registration | $5 per registration | |
|---|---|---|---|
| Registrations | 800 | 800 | 800 |
| Ad budget | $22,400 | $8,000 | $4,000 |
| ROAS | 1.3x | 3.75x | 7.5x |
Hypothetical. Same $3,000 offer, 10 buyers, 5% close and 25% show in every column. Revenue is $30,000 in each case.
Same offer, same close rate, same show rate. The budget moves more than fivefold. That's why we tune cost per registration and show rate before we touch anything else.
The last formula is the one most people never run. If you'll pay $1,000 to acquire a buyer, and you expect a 30% show and a 6% close, your ceiling is $1,000 × 30% × 6% = $18 per registration. At a 25% show and a 5% close, it drops to $12.50. Buy registrations above that line and every buyer costs more than you planned.
Two optional inputs change the result.
- Sales after the live session. In our experience, 30% to 50% of a webinar's sales close through the replay and follow-up, not live. There's no industry benchmark; the nearest public example is a single 2019 course launch that made 58% of its sales after the live webinars.[4] If 40% of your sales will come later, only 6 of your 10 buyers need to buy live, and you need 120 attendees, not 200.
- A paid bump after registration. A low-priced VIP or replay offer shown right after sign-up is taken by 5% to 12% of registrants on the funnels we run, and recovers roughly 40% to 50% of the ad spend. On the $8,000 column above, that's a net cost near $4,400. We cover the setup in the webinar order bump.
Where the defaults come from (and their catches)
Most webinar calculators ship defaults with no source. LaunchWebinars, for example, labels an $8 cost per registrant and a 33% show rate as averages without saying where they come from.[5] Here is where every number in our worksheet comes from, and the catch on each.
Cost per registration. No method-disclosed, multi-advertiser benchmark exists for webinar registrations. The nearest public yardstick is Meta's Leads-objective cost per lead. WordStream's 2025 data, from 726 campaigns, puts the median at $28.22 for Education and Instruction.[1] LocaliQ's 2026 average for the same industry is $26.31, with no sample disclosed.[2]
Median Meta Leads-objective cost per lead, Education and Instruction, April 2024 to June 2025
Against that, our reference points: first cold tests usually land at $12 to $20 per registration before optimization. For years, $8 to $10 was the best we saw. Our current best is $4 to $5, on a weekly evening webinar with ads only in the two days before. That program has run at 4x to 7x ROAS week over week. Treat those as what a tuned program can do, not as your first-test default.
Don't default to B2B numbers. Metadata's 2026 benchmarks, from 153 B2B advertisers, put Facebook cost per lead at $145.[6] That's a different buyer and a different lead.
Show rate. Every platform measures it differently, so check the denominator.
- Demio's 2023 data put Education Services at 20% and hosts under $1M in revenue at 22%.[7] That's the closest public proxy for a coach.
- Goldcast reported a 33% average for 2024, but its own averages, 51 attendees against 238 registrants, work out to about 21%.[8] For 2025 it reports 40%.[9]
- Livestorm's 2025 live show-up rate was 47.7%.[3]
- ON24's 60% is "total" conversion and includes on-demand viewers.[10] It isn't a live show rate.
Our planning range for a free single-date evening webinar on cold traffic is 25% to 35%. For a webinar promoted only to a warm list, it's 40% to 50%. The higher B2B platform figures come mostly from organic and house-list registrants, which is why they run above cold traffic.
Landing-page conversion. GetResponse found webinar landing pages converted 22.3% of visitors in 2023 data.[11] On cold Meta traffic, our registration pages convert 22% to 30%.
Click-through rate. If you work back to impressions, LocaliQ's 2026 Education lead campaigns averaged a 1.74% CTR.[2] A working cold webinar ad does 1.8% to 2.5% for us. Don't chain LocaliQ's separate averages into a cost per lead; they don't multiply out.
Close rate. No public benchmark exists for live attendee to buyer on a coaching or expert webinar. Our rule of thumb for a $1,000 to $10,000 offer is 6% to 10% when it's working and 1% to 3% when it isn't. Enter your own. For what each rate means and how to read it, see our webinar conversion benchmarks.
Your first webinar is a test, not a launch
Budget the first webinar to buy data, not profit. Here's a hypothetical baseline test: $2,000 of ads at $16 per registration buys 125 registrations. At a 30% show, that's about 37 live attendees. At a 6% close, that's 2 buyers.
Two buyers won't make the month. But you now know your real cost per registration, your real show rate and your real close rate, and every number in the worksheet stops being a guess.
Run the test alongside your own list. Email and SMS registrations cost nothing and show up better, so they lift the attendee count and make the pitch feel like a room, not a rehearsal.
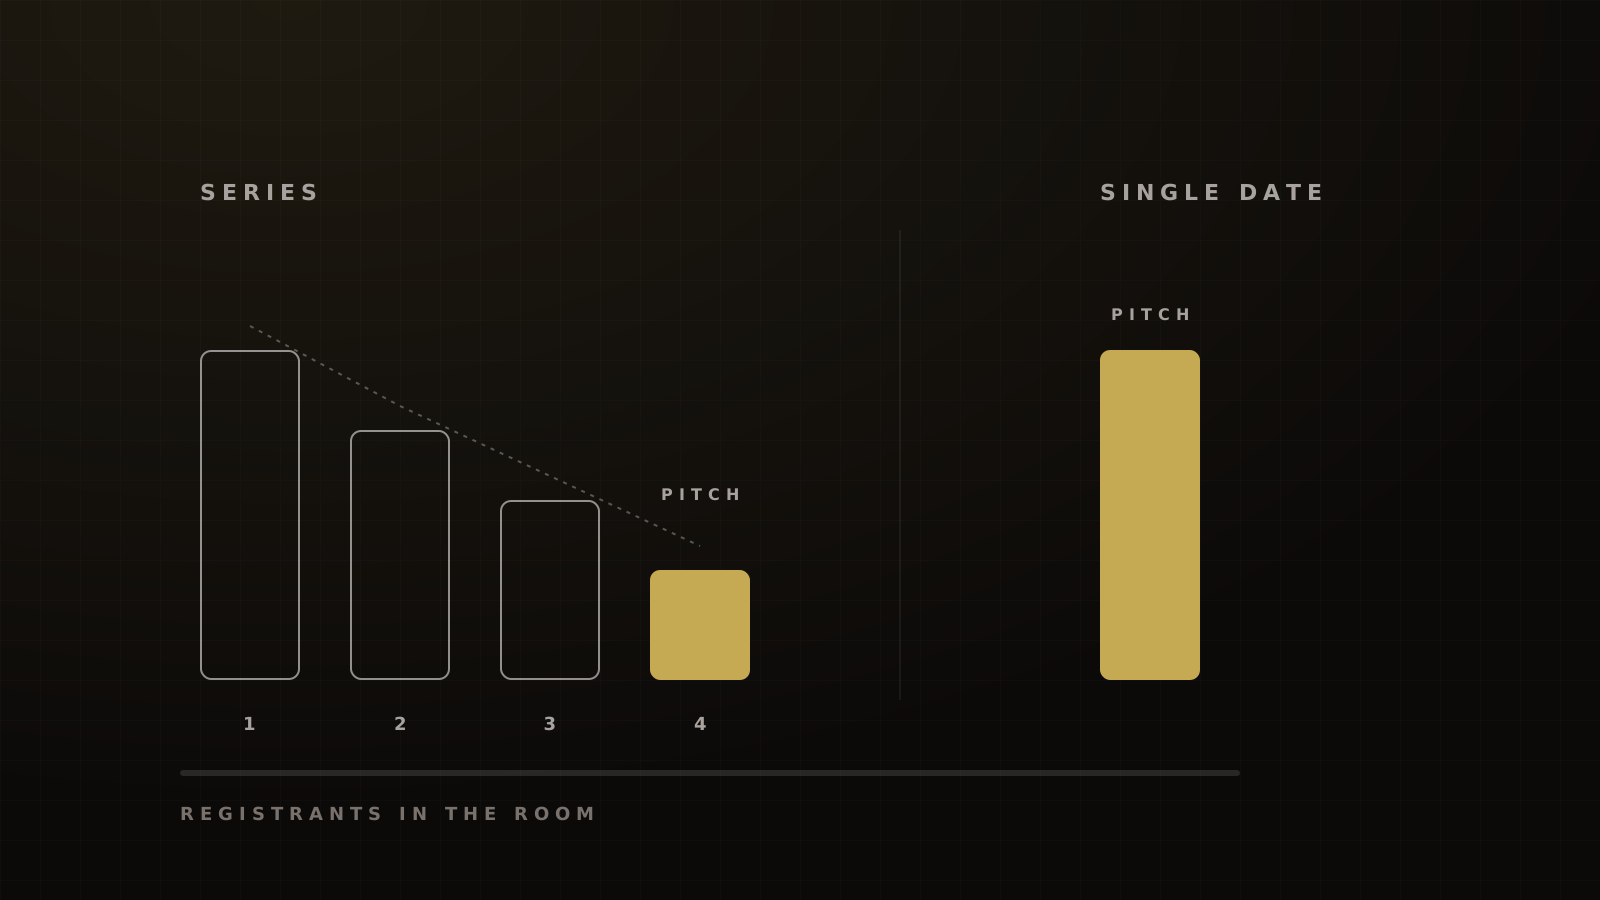
Measure five things: cost per registration, show rate, the share of attendees still there at the pitch, close rate, and sales in the follow-up window. Fix them in the order Jason Fladlien recommends: the offer first, then the audience, then the message.
When to spend: the last 48 hours
Put the paid budget in the two days before the webinar. That's how our weekly evening program runs. In our experience, starting ads two weeks out raises the cost per registration and lowers the show rate, because people who sign up early forget.
The public timing data points the same way. Livestorm found 49.6% of registrations happen in the final 7 days and 15.3% on the day itself.[3] Contrast's 2026 data shows 49% in the final 7 days, 23% within 48 hours and 14% on the day.[13]
Zoom found its 1,000 best-attended webinars had a 13-day median promotion window, against 9 days for the rest.[14] That's mostly list and organic promotion, and an association, not a test. So start your email and SMS earlier, and keep the paid window short.
After the test: scaling without breaking it
Fix conversion before you add spend. If the close rate is in the failing range, more registrations just buy more of the same result.
When the numbers hold, we stress-test before we scale: 7 days at the planned daily spend on a capped audience, or until the ad set has about 50 optimization events. Then we look at cash. Our target before raising spend on a client funnel is at least 1.5x 30-day cash on fully loaded acquisition cost. That's a target, not a promise, and Alex Hormozi argues for a higher bar for customer-financed growth.
Raise budgets in steps, not leaps, and rerun the worksheet with real numbers each time. Our paid ads guide for coaches covers the buying side.
For how the whole funnel fits together, start with our webinar funnel playbook. Want us to fill in your worksheet with you? Book a strategy call.
Frequently asked questions
Sources
- 1.Facebook Ads Benchmarks 2025. WordStream by LocaliQ, 2025, modified 2026-09-14.
- 2.Facebook Advertising Benchmarks for 2026. LocaliQ, 2026-09-23 (last updated).
- 3.Webinar Benchmark Report 2026. Livestorm, 2026-09-01.
- 4.Online Marketing Made Easy, episode 292 (transcript). Amy Porterfield, 2019-12-05.
- 5.Webinar revenue calculator. LaunchWebinars, undated, checked 2026-10-04.
- 6.B2B advertising benchmarks. Metadata.io, 2026 (2025 data).
- 7.Webinar Statistics 2024. Banzai (Demio), 2024-01.
- 8.B2B Webinar Benchmark Report 2025. Goldcast, 2025.
- 9.B2B Webinar Benchmark Report 2026. Goldcast, 2026.
- 10.The webinar guide (citing the 2026 Webinar Benchmarks Report). ON24, 2026 (page undated).
- 11.Email Marketing Benchmarks (2024 edition). GetResponse, 2024.
- 12.How to spot and avoid business coaching scams. FTC Consumer Advice, 2026-04-24.
- 13.Webinar Statistics 2026. Contrast, 2026-05-26 (updated).
- 14.How to promote a webinar: your pre-event strategy guide. Zoom, 2026-08-19.
Written by
Ray GillespieCo-Founder & COO
Ray runs day-to-day operations across every Victory engagement, building the systems, automations and AI-powered workflows that hold the machine together. He has overseen operations behind more than $120M in revenue.
Part of the guide: The Webinar Funnel Playbook: Live, Automated and Hybrid Webinars That Sell (2026)