Sales Team Capacity Calculator: How Many Closers Your Lead Volume Needs (and Why 80% Full Is the Ceiling)
Work out how many closers your lead flow needs, why every calendar caps at 80% full, and the ad spend at which your current team's intake breaks.
 Devin AlexanderCo-Founder & CEO
Published 8 min read
On this page
Key takeaways
- Closers needed = booked calls per week ÷ calls one closer can take at 75–80% fill. Round up.
- Booked calls = leads × contact rate × booking rate. Book a slot for every booked call, not just the ones you expect to show.
- No credible benchmark exists for calls per closer per day. Our working assumption is 4–6 high-ticket calls a day at 80% fill.
- Contact centers treat 75–85% occupancy as standard and above 85% as unsustainable.[1] Closer calendars need the same slack.
- Run it backwards: the ad spend at which your closers pass 80% is your spend ceiling until you hire.
The formula fits on one line: closers needed equals booked calls per week divided by the calls one closer can take at 75–80% calendar fill.
Booked calls per week are your leads times your contact rate times your booking rate. Book a slot for every booked call, not just the ones you expect to show. Then run it backwards. The ad spend at which your closers' calendars pass 80% is your current spend ceiling, unless you hire.
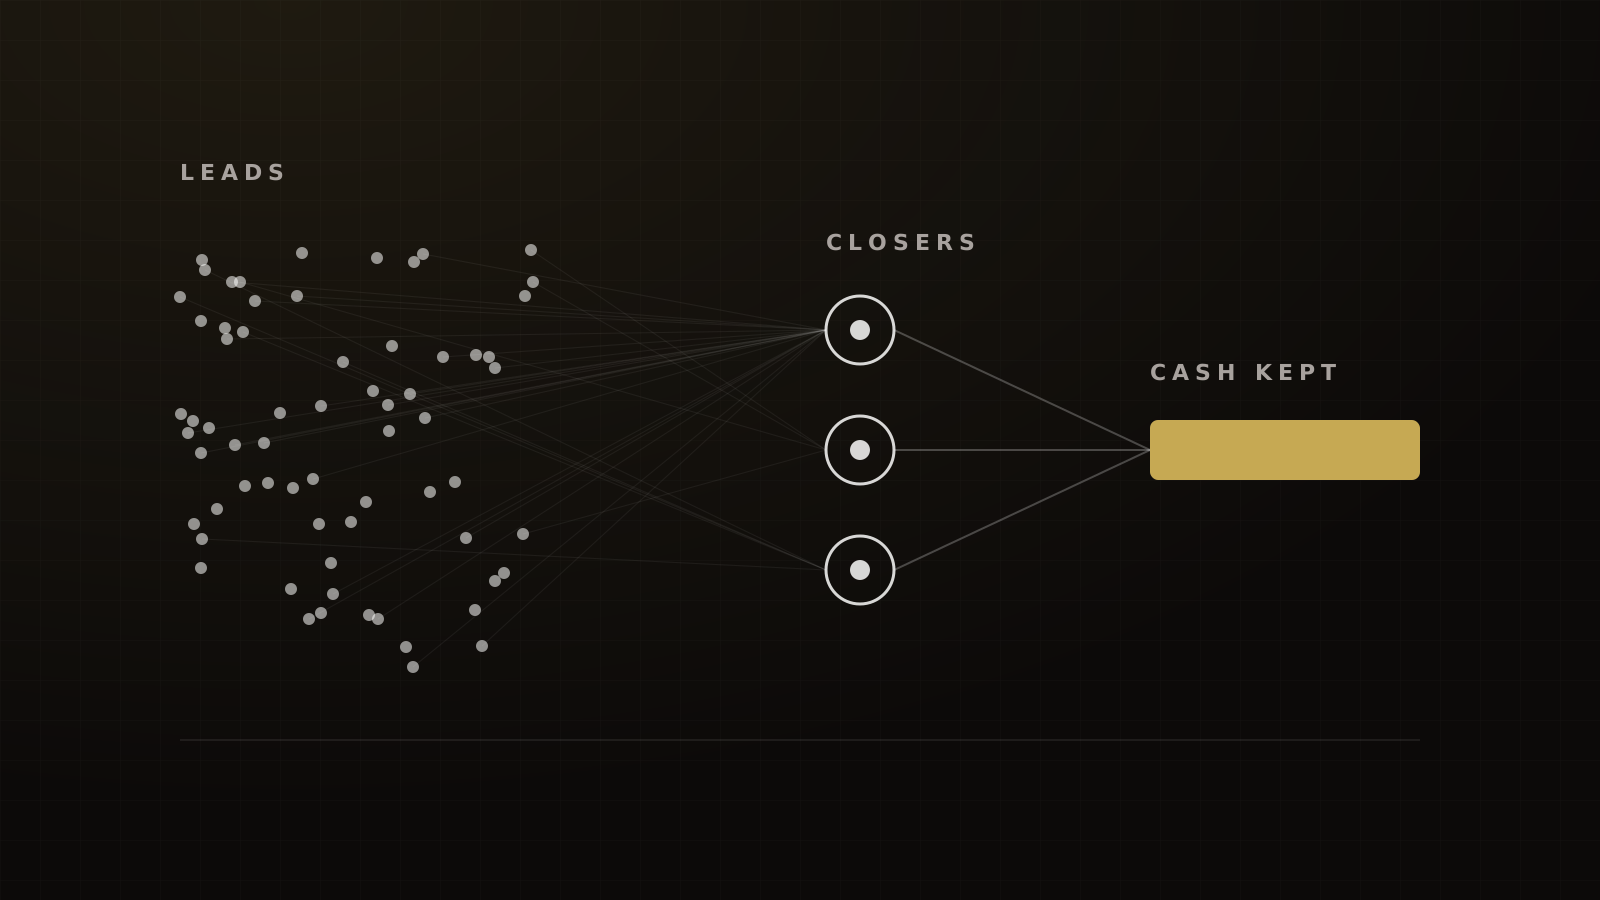
Most capacity calculators work top-down from a revenue target, quota and attainment. That's fine for a B2B sales org. It doesn't tell a founder buying leads on Meta whether the team can call them. This one starts from leads.
The calculator
Framework
The closer capacity model
- Booked calls per week = leads per day × selling days × contact rate × booking rate.
- Slots needed = booked calls per week. Every booking holds a slot, show or not.
- Raw slots per closer = (selling minutes per day ÷ (call length + buffer)) × selling days.
- Usable slots per closer = raw slots × max fill (default 80%).
- Closers needed = slots needed ÷ usable slots per closer, rounded up.
- Current fill = slots needed ÷ (current closers × raw slots). Above 80%, intake is breaking.
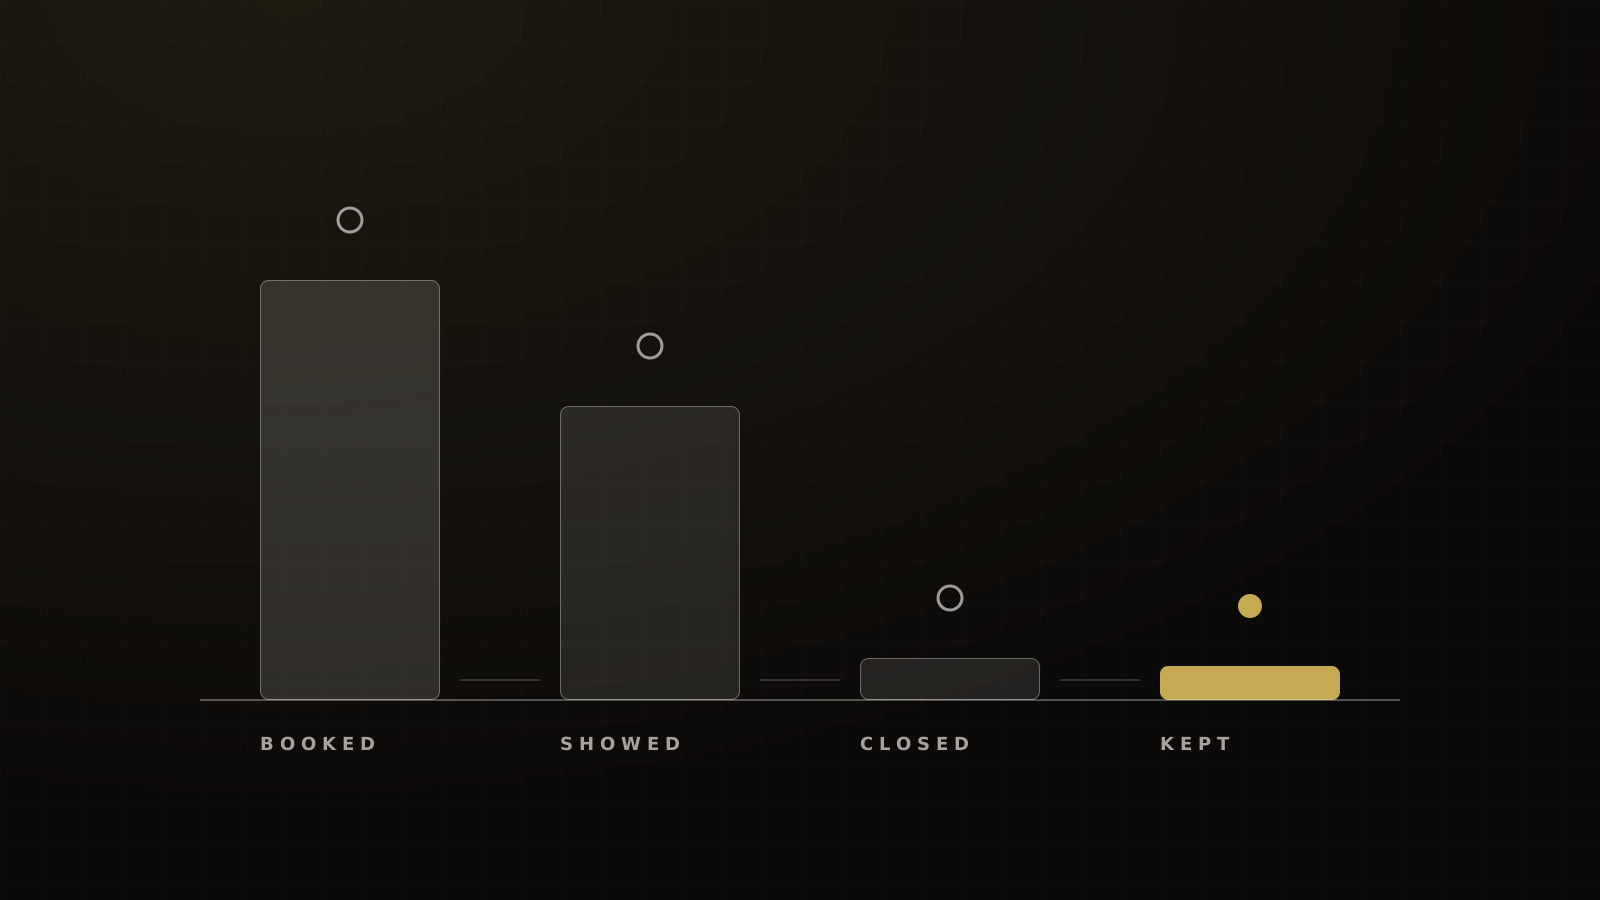
- Weekly sales and cash = booked calls × show rate × close rate × average cash collected per sale.
- Spend ceiling per day = (current closers × usable slots) ÷ (contact rate × booking rate) ÷ selling days × cost per lead.
Victory's model. Lead stages (uncontacted, contacted, engaged, qualified, sold) credited to Alex Hormozi.
Calculator
Sales team capacity calculator
Every booking holds a slot, show or not. Size the team so calendars stay under the fill ceiling.
Example inputs. Replace with your numbers.
Closers needed
3
52 bookings ÷ 24 usable slots per closer = 2.2, rounded up
- Current utilizationPast the 80% ceiling
- 87%
- Slack before you need to hireCalls a week over the ceiling. Hire or hold spend
- −4
- Usable slots per closer30 raw slots a week × 80%
- 24
- Held calls per weekShow rate changes held calls, not slots needed
- 44.2
Check the busiest day too. A team at 80% on average is often full on Monday.
How this is calculated
- Raw slots per closer per week = calls per closer per day × selling days
- Usable slots per closer = raw slots × max calendar fill
- Closers needed = booked calls per week ÷ usable slots per closer, rounded up
- Current utilization = booked calls ÷ (current closers × raw slots)
- Slack = current closers × usable slots − booked calls per week
- Held calls = booked calls × show rate
Estimates for planning, not a promise of results. The example inputs are illustrations, not Victory client results.
Here's the model with made-up numbers, so you can check the arithmetic before you plug in your own.
| Input or output | Value |
|---|---|
| Leads per day, 5 selling days | 30 (150 a week) |
| Contact rate | 70% |
| Booking rate (of contacted) | 50% |
| Booked calls per week | 52 |
| Call length + buffer | 45 + 15 minutes |
| Selling hours per closer per day | 6 |
| Raw slots per closer per week | 30 |
| Usable slots per closer at 80% | 24 |
| Closers needed | 3 (52 ÷ 24 = 2.2) |
| Current fill with 2 closers | 87%, past the ceiling |
| Show rate / close rate of shows | 85% / 20% |
| Weekly sales / cash collected | ~9 / ~$44,000 |
| Cost per lead | $40 |
| Spend ceiling with 2 closers | ~$1,100 a day |
Every input is hypothetical. The 80% max fill is our default, not an industry benchmark. Swap in your own numbers from a recent lead cohort.
In this example the founder is already over the line. Two closers at 87% fill have no room for follow-up, and every extra dollar of ads buys leads that won't get a timely call. Either hire the third closer or hold spend near $1,100 a day.
The inputs that matter, and where to get yours
There's no credible public data on contact or booking rates for consumer phone intake. Pull your inputs from a recent cohort of your own leads: everything that came in during one recent month, followed for two weeks.
Contact rate and attempts
Contact rate depends on how hard you try. Velocify found 48% of converted leads were first reached on the first call attempt and 93% by the sixth, yet half of leads never got a second call.[2] Many companies barely try: in a 2013 test of 9,538 companies, 47% never responded to a web lead at all, and the median number of contact attempts was one.[3]
The lag is often worse than the effort. In InsideSales' 2021 analysis of 5.7 million inbound leads, 57.1% of first call attempts came more than a week after the lead arrived.[4]
Your contact-rate input assumes a cadence. Ours: median first dial under one hour during staffed hours, every new lead dialed within 24 hours, and at least six attempts on every unconverted lead in its first two weeks. If your team doesn't run that cadence, your measured contact rate will be lower, and so will your capacity math. Hormozi's "open to goal" idea fits here: set the daily outcome, and keep dialing until it's hit. The research behind fast follow-up is in speed to lead.
Booking rate
Booking rate is the share of contacted leads who take a call. B2B self-scheduling data is the closest public reference. Chili Piper found 66.7% of qualified demo forms booked a meeting, and 69.2% when a live-call option was offered.[5] RevenueHero puts the median at 62% of qualified inbound leads, with top performers at 78% or more.[6]
Those are B2B forms with scheduling built in, not a phone conversation with a consumer. Use them as a ceiling check, not a default.
Show rate (book slots for no-shows)
Show rate doesn't reduce the slots you need. It changes how many of them turn into held calls. You can't know in advance which slot will go empty, so every booking holds one.
In our experience, phone calls booked no more than about three days out show at 82–88%. B2B meetings average a 15.9% no-show rate across RevenueHero customers,[7] and education and e-learning software ran 18.1% in a one-week snapshot.[8] Book far out and it climbs: Reply.io saw 23% no-shows on demos booked 8 or more days ahead.[9] How to raise yours is in how to reduce sales call no-shows.
Hours a closer really has
A closer's working hours aren't their selling hours. Reps in Salesforce's 2026 survey said they spend 40% of their week selling.[10]
A call also costs more than its slot. Sales engineers in Navattic's 2026 survey reported 3.6 hours per standard demo once prep is included.[11] That's B2B software, but the lesson carries: set the buffer input honestly, including notes, CRM updates and the follow-up text.
For calls per day, we work from 4–6 high-ticket calls per full-time closer at 80% fill. That's a working assumption, not a benchmark. The nearest public figure is for B2B SDRs: 4.1 quality conversations a day, 4.6 on phone-centric teams.[12]
Why 80% full is the ceiling
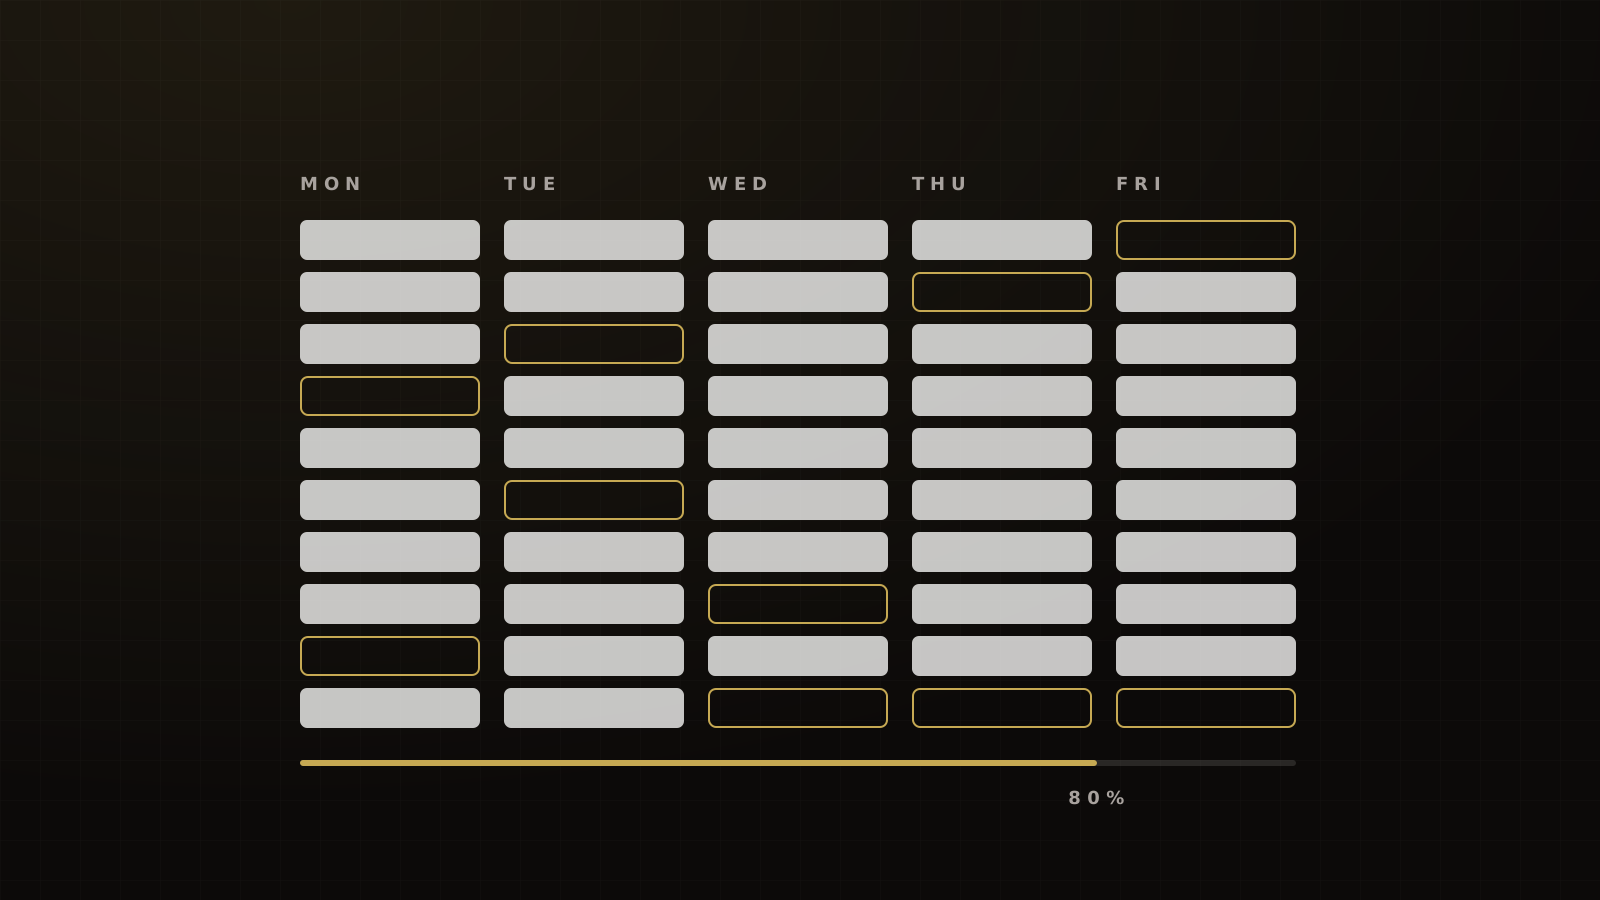
We cap closer calendars at 75–80% of available slots. The remaining slots do four jobs: follow-up with buyers who are deciding, calling no-shows within minutes, rebooking, and dialing new leads.
Fill a calendar to 100% and all four stop. The calendar looks productive while the pipeline behind it rots.
Contact centers learned this long ago. SQM Group describes 75–85% agent occupancy as the industry standard, with anything above 85% widely seen as unsustainable for long periods.[1] That's an analogy, not sales data, but the mechanism is the same. Queueing theory explains it: as utilization approaches 100%, small surprises (a long call, a late buyer, a burst of leads) turn into long waits.
The 80% line also absorbs peaks. Leads don't arrive evenly, so a team at 80% on average is often full on Monday. Check the busiest day, not just the weekly average. If a day or time band has no free slots, the model is telling you to hire before the weekly number says so.
Turn the answer into an ad budget
Lead generation and closing are two engines. Scale leads only as fast as closing and intake can absorb them.
The spend ceiling in the model is that rule in dollars. Past it, extra leads don't become extra calls. They become uncalled leads, and the ads get blamed. We've written up what that looks like in 1,000 leads, 16 sales.
When the model says intake is breaking, you have three moves:
- Add a closer if calendars are full and the offer pays a rep well per hour.
- Add a setter only when closers sit at 75–80% and more than about 20% of new leads are still uncalled after 24 hours. That's our trigger, not an industry rule.
- Hold spend until the hire is ramped.
Capacity isn't the only gate on spend. We also want 30-day cash of at least 1.5x fully loaded acquisition cost before we raise a client's budget. That's our target, not a result. Hormozi sets his "real life" minimum at 2x. Budget mechanics are in our paid ads guide for coaches.
Ramp: new closers aren't full capacity
Don't count a new hire as a full closer on day one. In our experience an experienced placed closer reaches a full call load within 2–4 weeks, so the model's default ramp is four weeks. The B2B benchmarks run far longer: a 6.2-month ramp for account executives[13] and 3.0 months for SDRs.[12] Those are larger, slower deals.
Plan for turnover too. Bridge Group reports a 40% median annual attrition rate for SDRs.[12] If you're running at the ceiling with no bench, one resignation puts you over it. Pay matters to retention, and how to pay high-ticket closers and setters covers it.
Callers must still follow consent, Do Not Call and calling-hour rules, however fast you dial. For the full team build, see building a high-ticket sales team, or book a strategy call and we'll run this model on your numbers.
Frequently asked questions
Sources
- 1.Industry standards for top call center KPIs. SQM Group, 2023-01-19.
- 2.The Ultimate Contact Strategy. Velocify, 2012-12 (approx.).
- 3.Annual 2014 Lead Response Report. InsideSales.com (XANT), 2014.
- 4.Response time matters (2021 Lead Response Research). InsideSales, 2021.
- 5.2025 Benchmark Report on Demo Form Conversion Rates. Chili Piper, 2025-02-18.
- 6.Industry benchmarks for inbound meeting conversion. RevenueHero, 2026-02-20.
- 7.Ways to reduce no-show rates in sales calls. RevenueHero, 2025-08-18.
- 8.No-show benchmark: week of December 2, 2024. RevenueHero, 2024-12-13.
- 9.How to fight demo no-shows. Reply.io, 2023-08-08.
- 10.State of Sales, 7th edition. Salesforce, 2026.
- 11.State of Demo Automation 2026. Navattic, 2026.
- 12.2025 SDR Models, Motions & Metrics Report (10th edition). The Bridge Group, 2025-02-06.
- 13.2026 AE Models, Motions & Metrics (10th edition). The Bridge Group, 2026-06-22.
Written by
Devin AlexanderCo-Founder & CEO
Devin architects Victory's revenue systems: team structure, comp plans, scripts and the accountability frameworks that make sales floors predictable. He has generated more than $150M in sales and trained more than 250 closers.
Part of the guide: Building a High-Ticket Sales Team: Setters, Closers, Comp Plans and Show Rates